Grok Statistics
Last updated on July 6, 2026

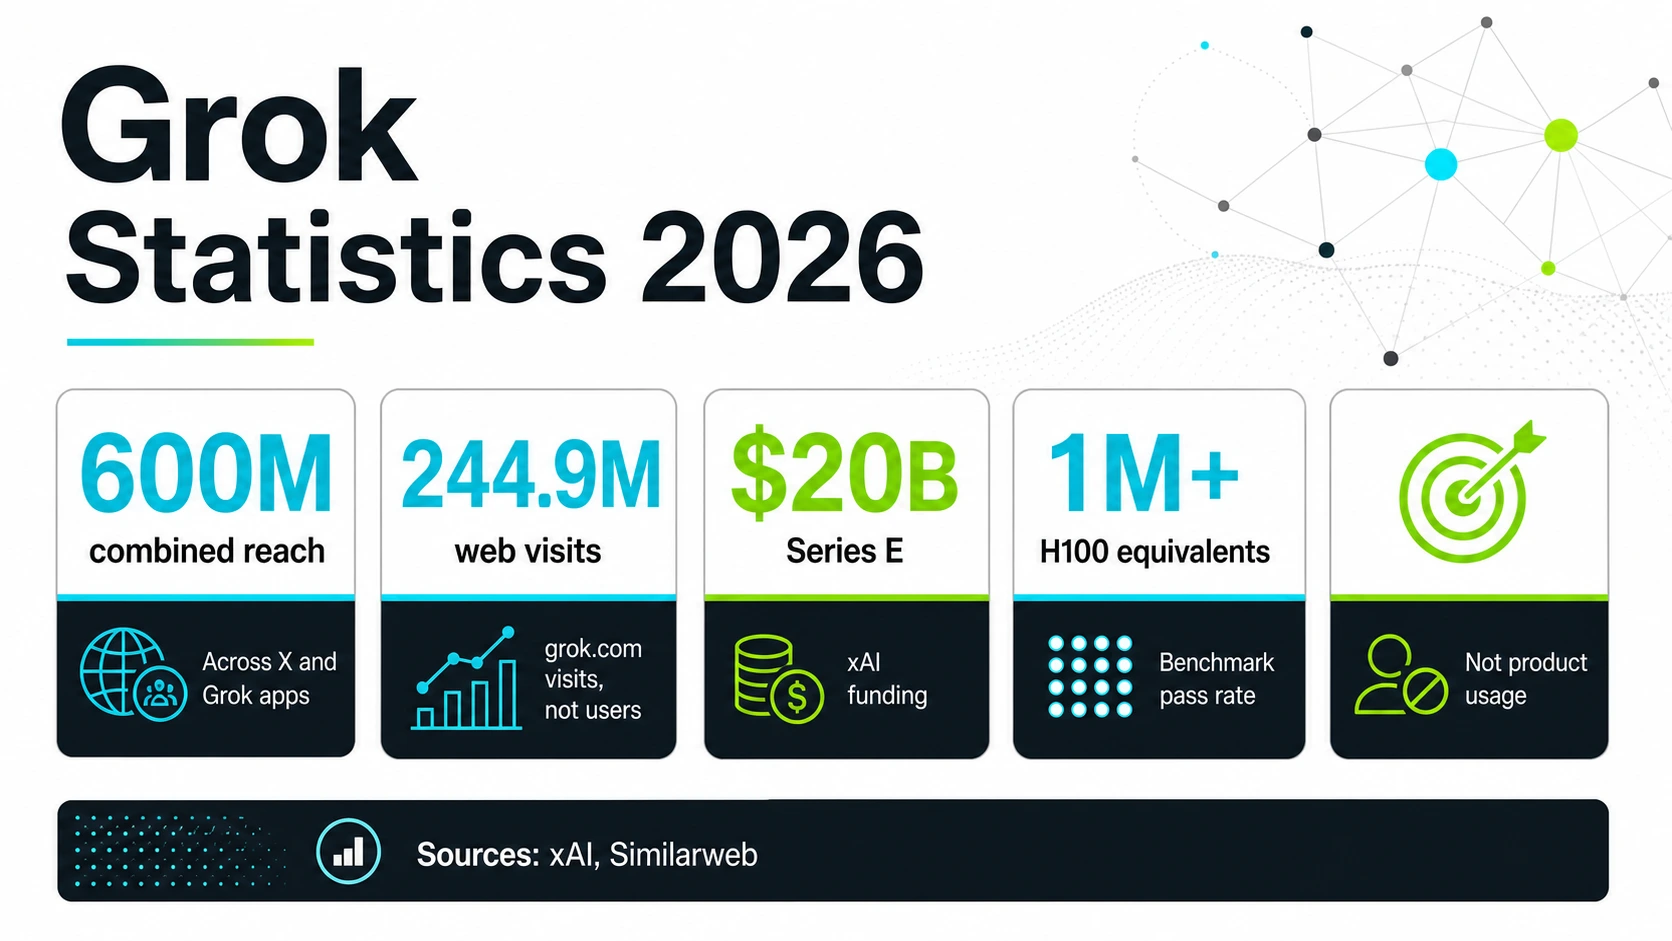
Grok is hard to measure with one clean number. xAI now talks about a product that reaches users through Grok’s own web and app experience, X, mobile app stores, developer APIs, Amazon Bedrock, business support, and government procurement channels. That makes Grok bigger than a single chatbot surface, but it also makes sloppy statistics risky.
The most important Grok number in 2026 is xAI’s own January disclosure that it had about 600 million monthly active users across X and Grok apps. That is a huge distribution signal — but it is not the same as standalone Grok monthly active users. The useful way to read Grok statistics is to separate reach, product access, web traffic, app distribution, API pricing, model benchmarks, funding, compute, and market context.
Grok In 2026: What The Numbers Say
The headline Grok numbers use different denominators, so read them as separate reach, web-traffic, model, and company-capacity signals rather than one figure.
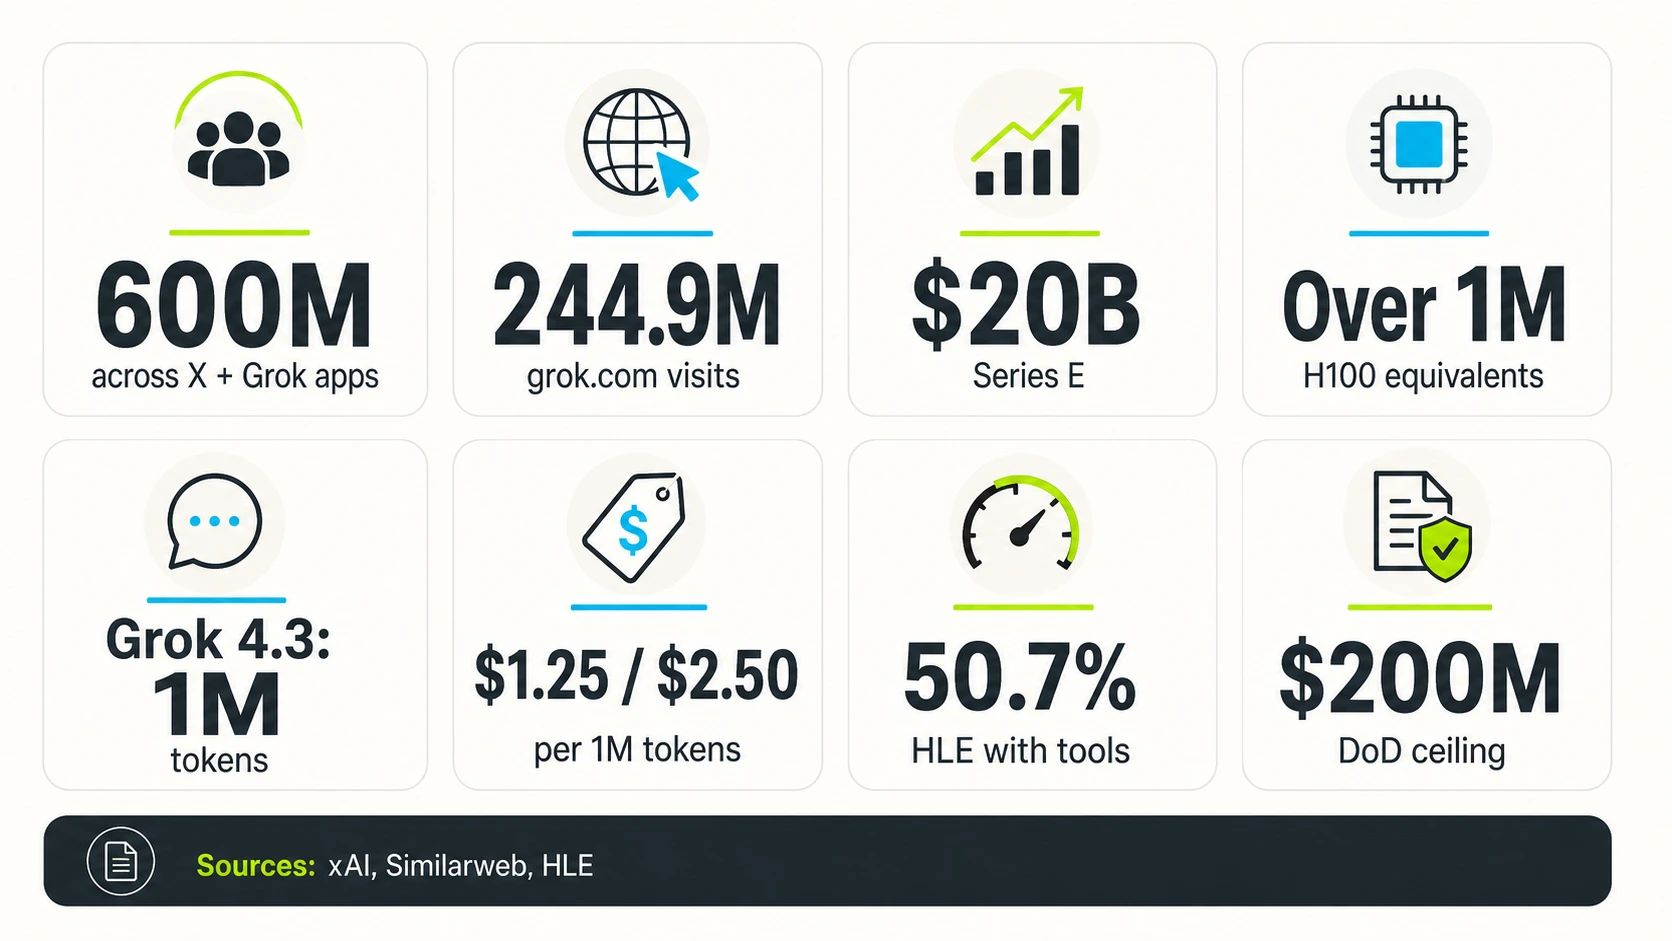
Reach, web traffic & distribution
Model, API & company capacity
Read every number by its own denominator
Grok's headline figures answer different questions. Tap a metric to see what it measures — and what it does not prove.
xAIKeeping Grok’s Metrics In Separate Lanes
The main trap in Grok statistics is denominator drift. A number can be true and still be misleading if it is attached to the wrong subject. xAI’s 600 million combined monthly active users describes activity across X and Grok apps. It is useful because X is a major distribution channel for Grok inside X. It is misleading if rewritten as “Grok has 600 million monthly active users.”
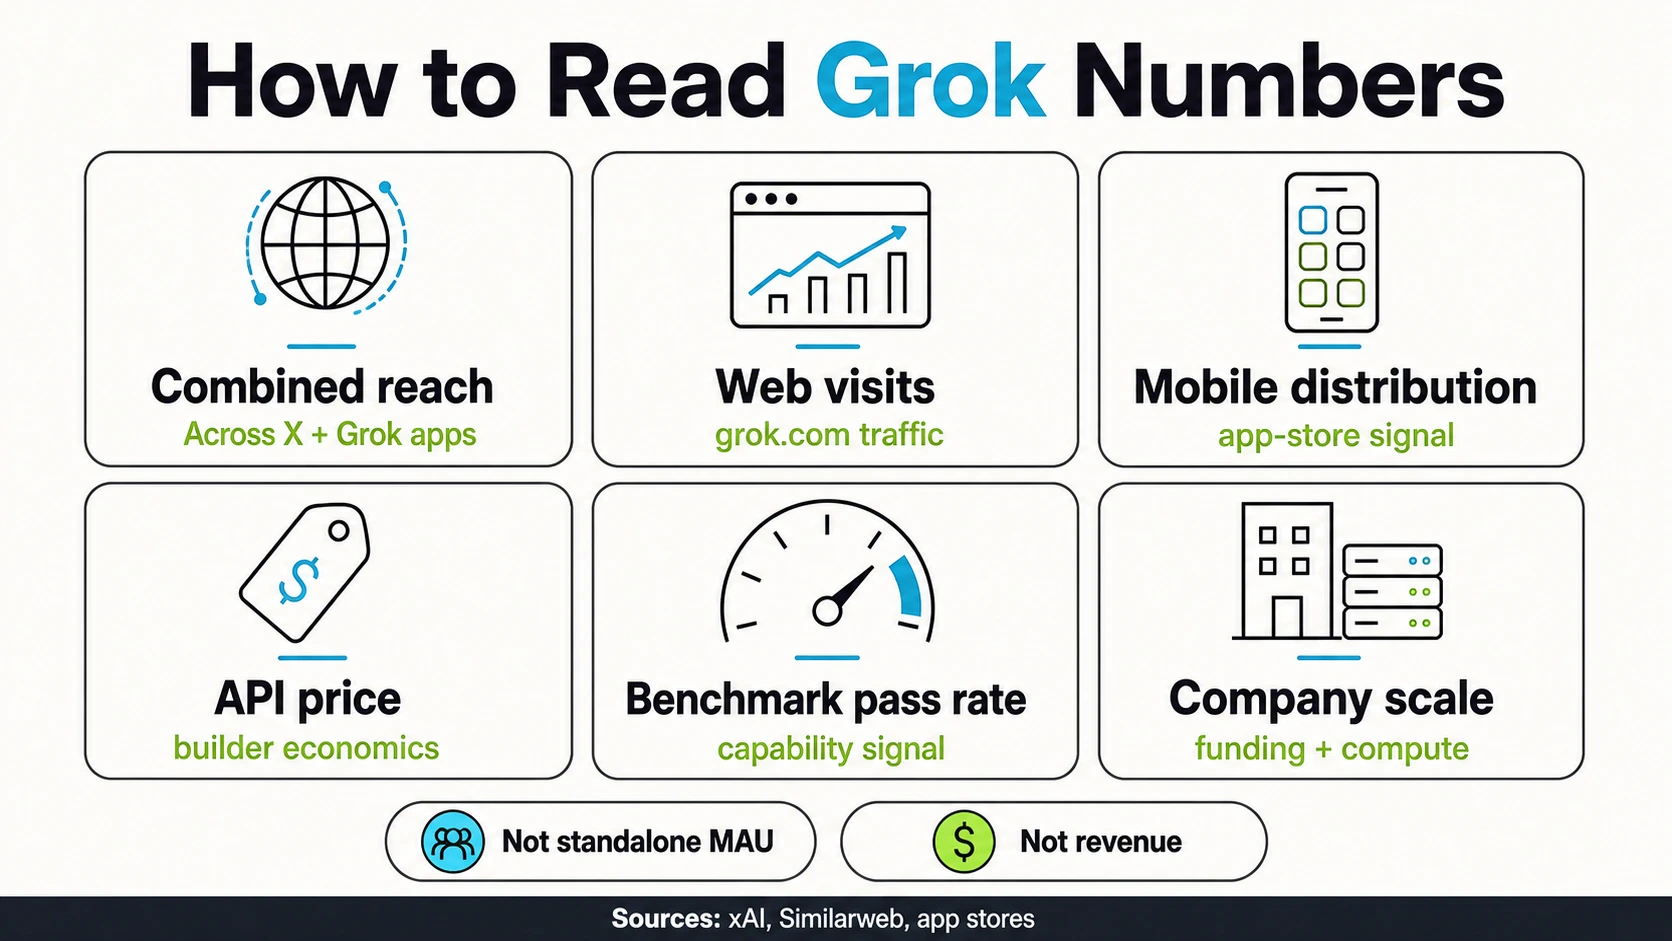
The same rule applies to every other public signal. Similarweb’s 244.9 million May 2026 visits measure visits to grok.com, not people, accounts, retention, or customers. A person can visit more than once; some visits may not become product activation; web visits omit X-only users and app-only users. That does not make the number useless — it makes it a web demand signal.
Mobile app data has the same issue. The Google Play listing and App Store listing show distribution, app packaging, public metadata, ratings context, and in-app purchase surfaces. Those are important if you are tracking Grok as a consumer AI app. They are not the same as daily active users. Benchmark numbers are even easier to overread: Grok 4 Heavy’s results on Humanity’s Last Exam, ARC-AGI-2, and the evaluations cited on xAI’s Grok 4 page describe capability under benchmark conditions, some with tools, browsing, code execution, or parallel agents.
Product reach
Combined X + Grok monthly actives and X-linked access — a distribution signal, strongest in official disclosures.
Product usage
Web visits, engagement, and app distribution proxies — demand signals, not unique users or retention.
Model capability
API context windows, token pricing, and benchmark scores — capability and cost signals under defined conditions.
Company capacity
Funding rounds and GPU scale — resources to build and serve models, not proof of product adoption.
The clean way to use Grok statistics is to keep four layers separate: product reach, product usage, model capability, and company capacity. Public sources are strongest on reach, distribution, API pricing, benchmark claims, funding, and compute. They are weaker on standalone Grok MAU, paid seats, retention, revenue, and market share.
Product Timeline: From X Chatbot To Multi-Surface Platform
Grok started as a tightly X-linked assistant. xAI’s original Grok announcement in November 2023 positioned it as a conversational AI with access for X Premium+ users. That launch matters because the early product was not measured like a standalone mobile app or API platform. It was attached to X distribution from day one.
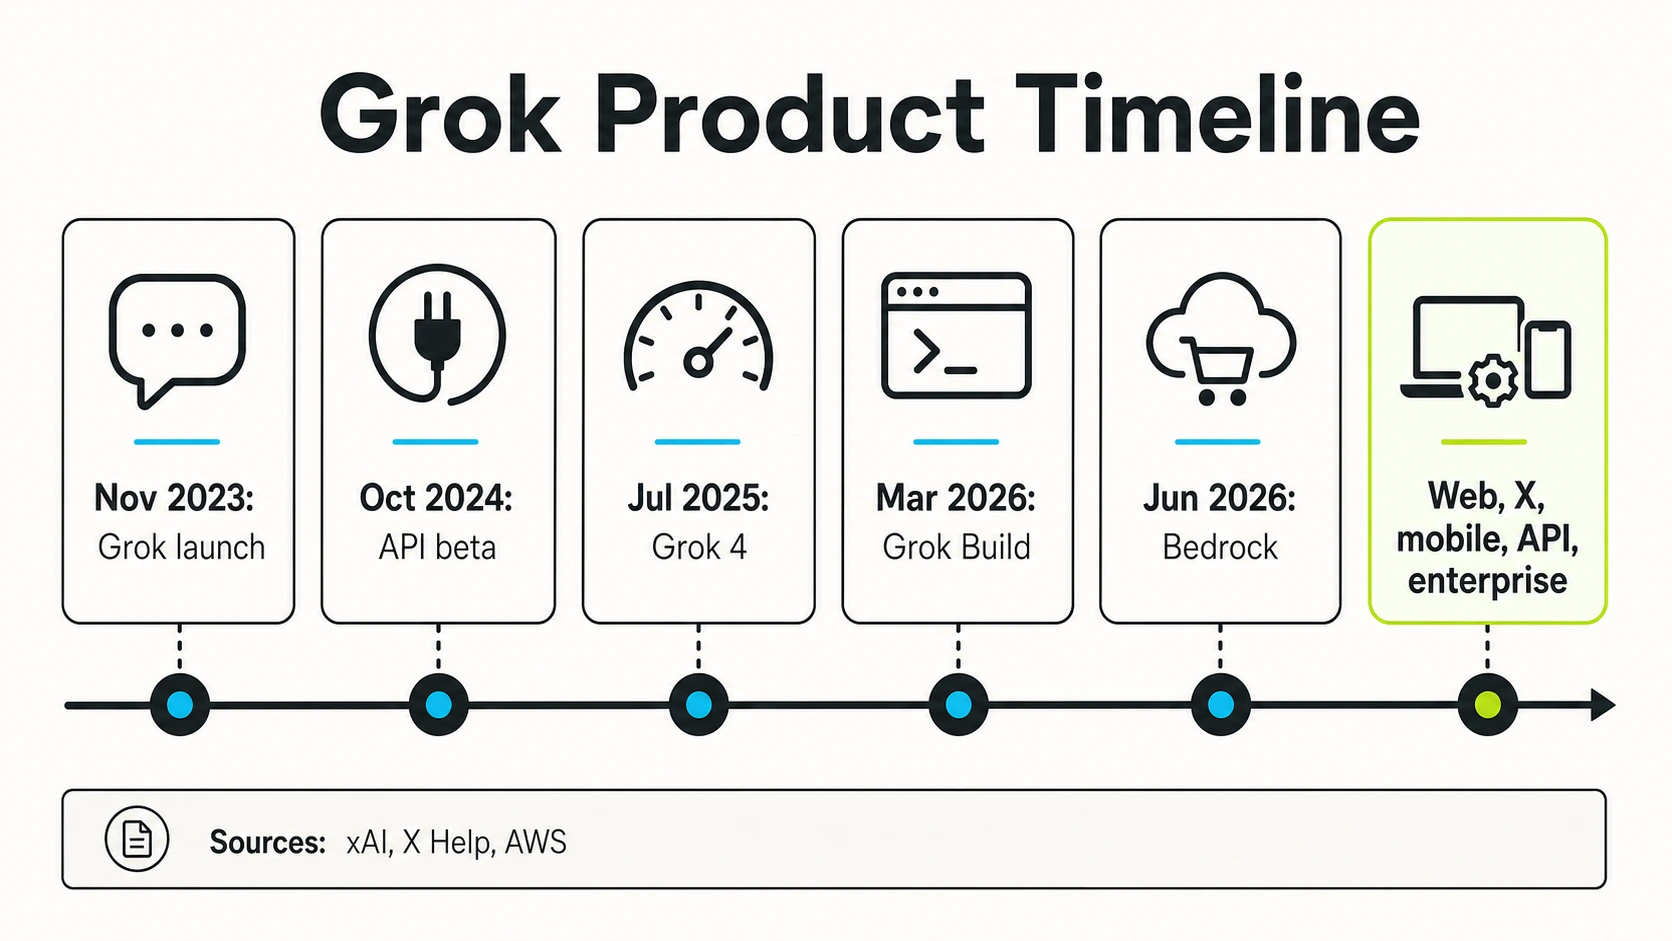
The next phase made Grok more model-centric. xAI released Grok-1.5 in March 2024, followed by Grok-2 in August 2024. These releases added model-performance and capability claims to the product story. The developer surface arrived later in 2024: xAI announced an API public beta in October 2024, then expanded consumer access in December with a free Grok rollout and Aurora image generation.
Grok's product surface, phase by phase
Grok launched as a conversational AI for X Premium+ users, attached to X distribution from day one rather than a standalone app funnel.
Grok-1.5 (March 2024) and Grok-2 (August 2024) added model-performance and capability claims, making benchmarks part of Grok’s statistics profile.
An API public beta (October 2024), a free Grok rollout, and Aurora image generation (December 2024) turned Grok into a web, app, model, and media product.
Grok 3 added reasoning and DeepSearch positioning; Grok 4 and Grok 4 Heavy shipped a benchmark-heavy launch; Grok Code Fast 1 and Grok 4 Fast moved Grok into agentic coding and efficient inference.
Grok Build CLI made Grok a voice-first app-building tool, and Grok on Amazon Bedrock brought Grok 4.3 into an enterprise cloud buying motion.
Grok's measurable surface widened from an X-only assistant into a web, app, API, coding, cloud, and government platform. Tap a phase to see what shipped.
xAIThe 2025 launches made the shift clearer. Grok 3 introduced stronger reasoning and DeepSearch-style positioning. Grok 4 then put Grok 4 and Grok 4 Heavy into a benchmark-heavy launch, with SuperGrok, Premium+, and API availability. Grok Code Fast 1 moved Grok into agentic coding, while Grok 4 Fast focused on cost, context length, and latency-style efficiency. The 2026 surface is broader still: Grok Build CLI made Grok a voice-first app-building tool, and Grok on Amazon Bedrock brought Grok 4.3 into an enterprise cloud buying motion. That timeline also explains why old Grok summaries age quickly: a 2024-era view could focus on X Premium+ and early model releases, while a 2026 view has to account for combined X/Grok reach, grok.com traffic, mobile apps, token pricing, model cards, coding agents, AWS distribution, and government procurement.
Adoption And Distribution Signals
The strongest official reach metric is still the combined xAI/X/Grok one. xAI’s Series E announcement said the company had about 600 million monthly active users across X and Grok apps. That number matters because X is central to Grok’s distribution, but it has to stay in its lane: it is combined reach, not standalone Grok MAU.
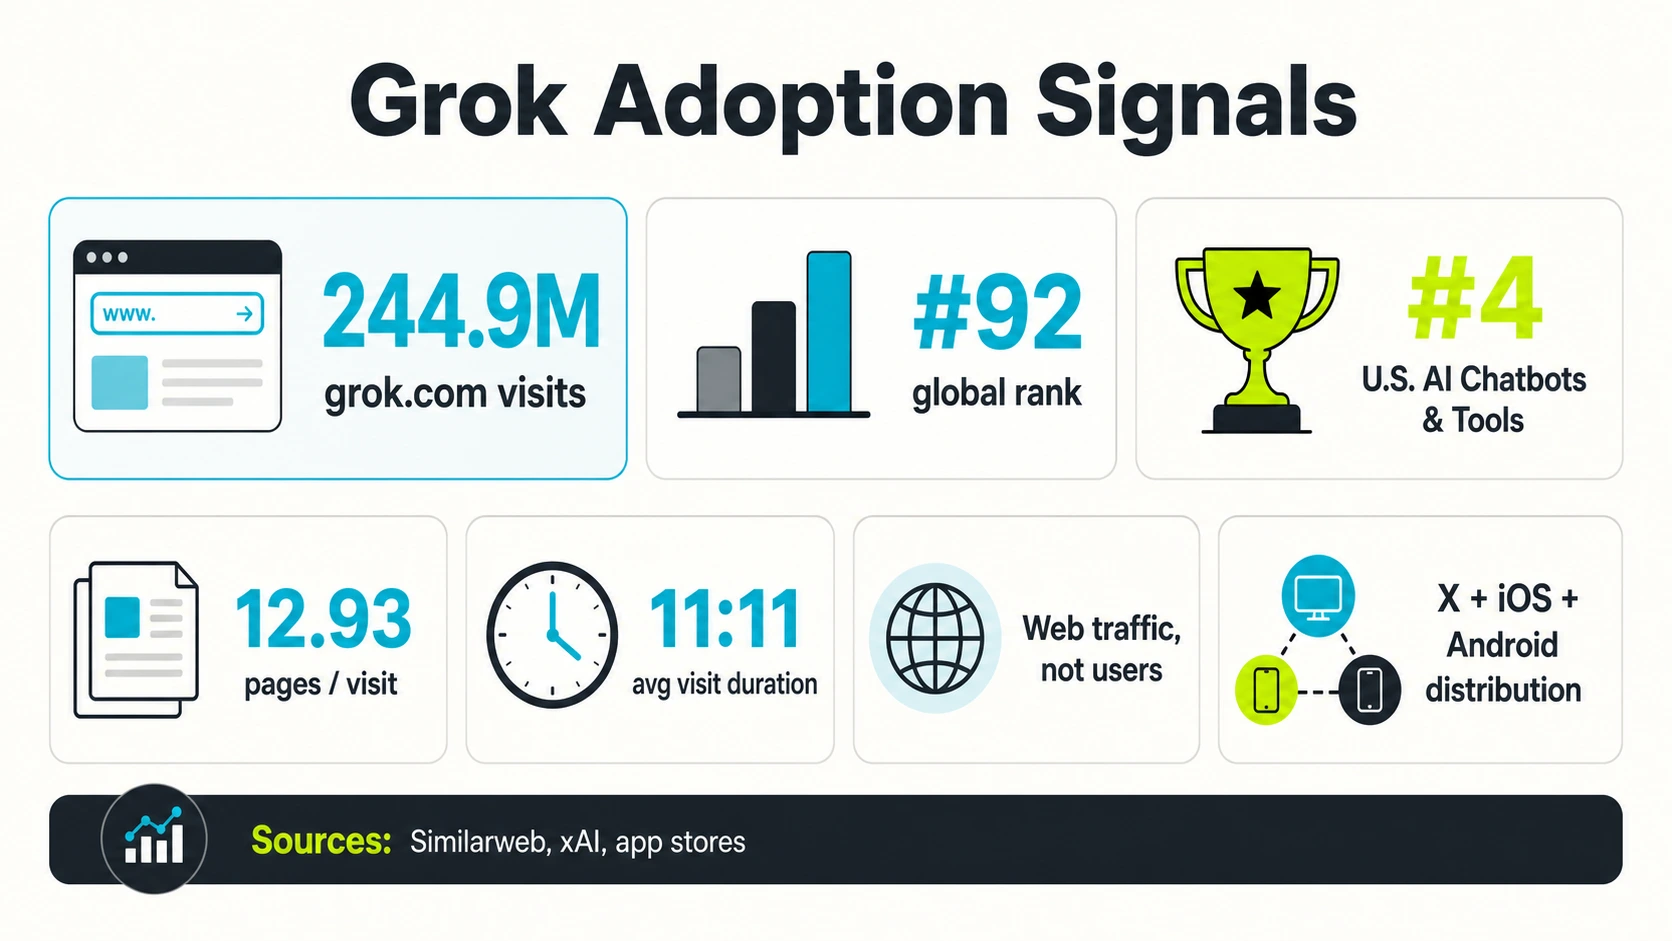
For standalone web demand, Similarweb’s grok.com page is the most concrete public proxy. Its May 2026 estimate of 244.9 million visits is large enough to treat grok.com as a major AI assistant destination. The same page’s 12.93 pages per visit and 11:11 average visit duration suggest deep engagement among web visitors. Still, visits are not unique users, and web traffic does not include all Grok usage inside X, mobile apps, API calls, or Bedrock deployments.
The country and channel estimates are useful but should not be overmapped. Similarweb’s grok.com page estimated the United States at 25.27% of desktop traffic and direct traffic at 67.22%. That suggests strong brand or habit-driven traffic, but it does not identify customer headquarters, revenue geography, or paid adoption. Mobile distribution adds another layer: on Android, the Google Play listing gives a public app record for package, category, update cadence, and install bucket; on iOS, the Apple App Store listing identifies the app, publisher, category, age rating, and in-app purchase surface. These are real product signals — they do not answer retention or active use.
Subscriptions, Access, Pricing, And API Economics
Grok monetization is public in surfaces, not in totals. You can see paid access routes, API prices, mobile in-app purchases, and enterprise cloud access. You cannot see standalone Grok revenue from public xAI disclosures.
Consumer access starts with the Grok product page, X’s Grok help page, and X Premium help. These pages help explain free access, paid plan context, and X-linked availability — but they are not subscriber-count pages. If a forecast uses X Premium or SuperGrok access as a revenue proxy, it should label that assumption rather than pretending the number is public. Mobile app listings add billing clues: the Apple App Store listing shows in-app purchases for Grok-related plans, and the Google Play listing gives the Android app record. App-store billing does not expose total subscriber count, churn, or revenue mix.
Grok API model economics (xAI docs, accessed July 4, 2026)
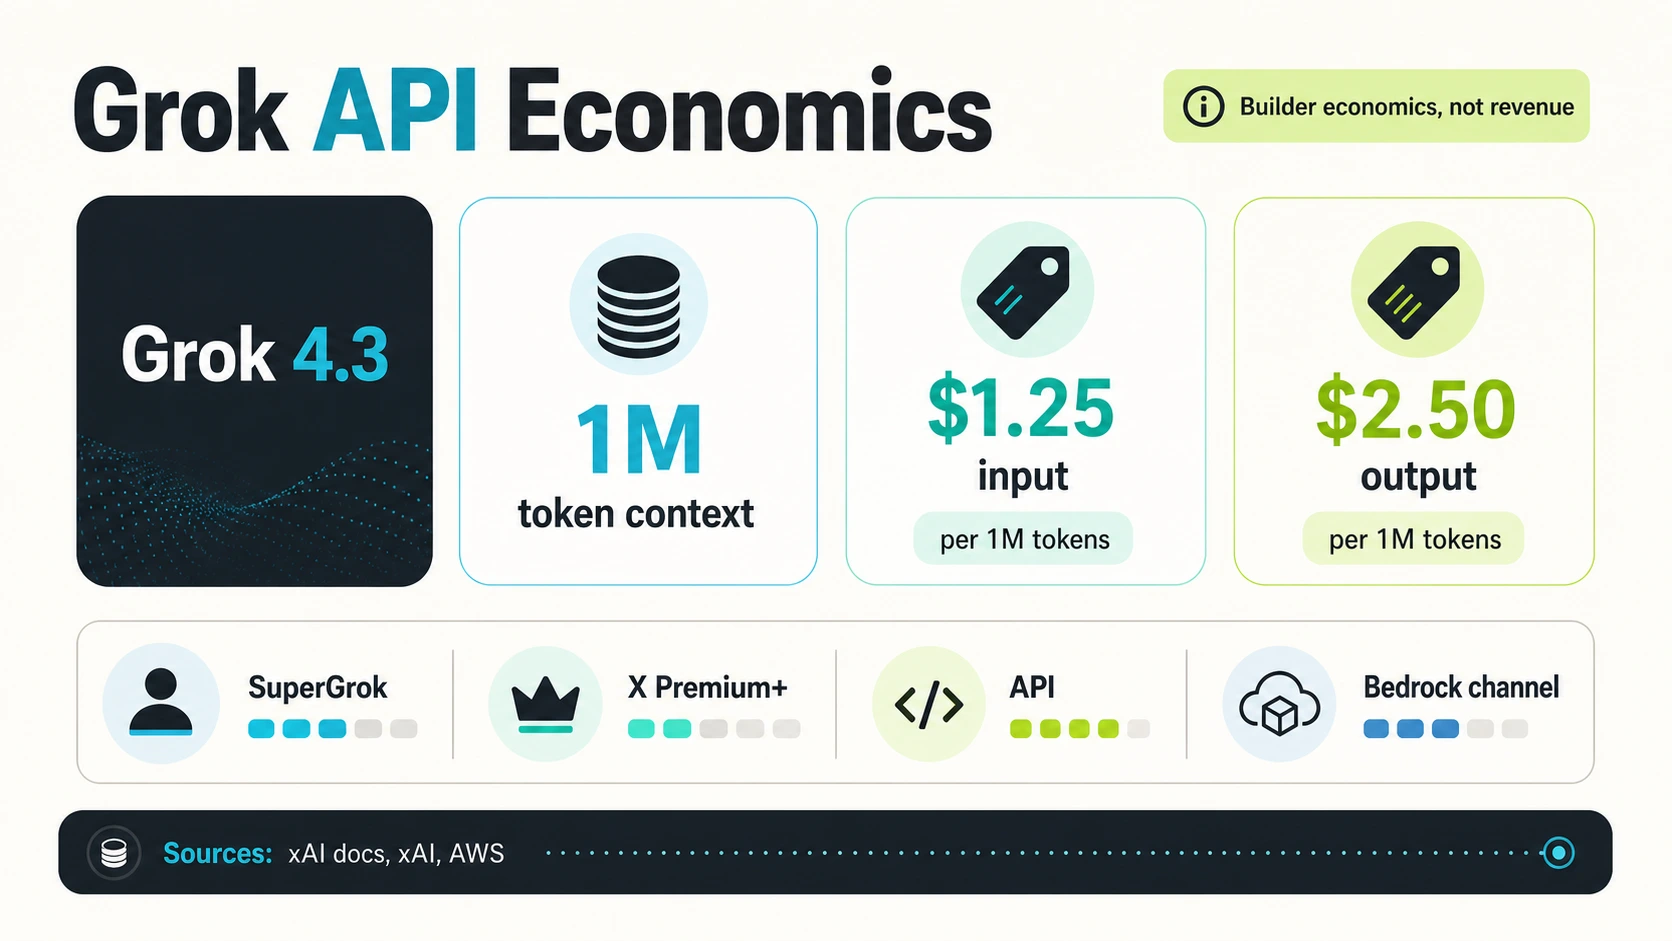
For builders, xAI’s models and pricing pages are the primary sources. As accessed on July 4, 2026, the docs listed Grok 4.3 at a 1 million token context window with $1.25 input and $2.50 output per 1 million tokens. The pricing page also lists prices for text, image, video, voice, and server-side tool endpoints, which makes Grok a broader API platform than a simple chat-completions product. If you are a developer choosing an AI search, coding, or reasoning model, the relevant statistic is not just the sticker price — it is the price for a task at a given latency, context length, and accuracy target. Enterprise access now has a separate path through AWS: xAI’s Grok on Amazon Bedrock announcement makes Grok easier for AWS-centered teams to evaluate through existing procurement, though it does not disclose the number of Bedrock customers using Grok.
Benchmarks And Model Performance
Grok’s public model story is benchmark-heavy, and those numbers are useful only when the benchmark caveat stays visible. The Grok 4 page presents Grok 4 and Grok 4 Heavy with a range of reasoning, coding, math, and tool-use results — Humanity’s Last Exam, ARC-AGI-2, GPQA, AIME, HMMT, USAMO, LCB, and other benchmarks.
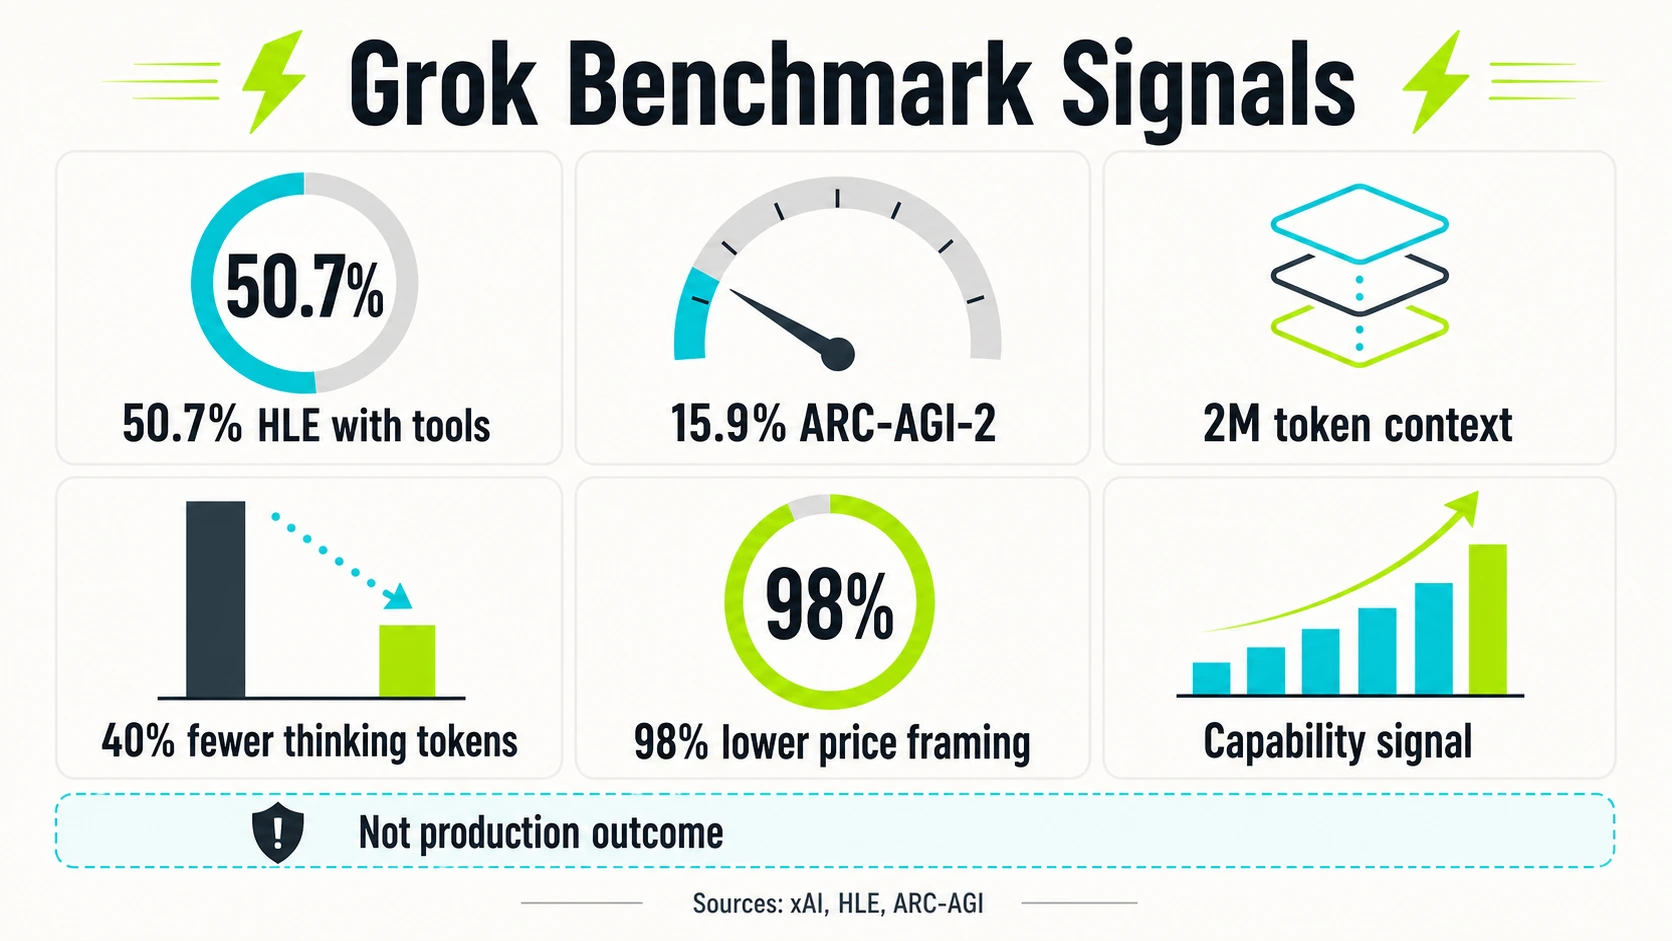
The most cited numbers should carry their setup. xAI says Grok 4 Heavy scored 50.7% on the text-only subset of Humanity’s Last Exam with tools and 15.9% on ARC-AGI-2. Those are impressive capability signals. They are not production success rates, and they should not be averaged with web traffic or app-store metrics.
The same is true for math and coding: xAI’s Grok 4, Grok Code Fast 1, and Grok 4 Fast pages describe benchmarks and product design for coding, reasoning, and efficient inference. A founder evaluating Grok for code tasks should look at benchmark family, context length, tool access, latency, token cost, and task style. Independent benchmark sources help ground the comparison: Artificial Analysis described Grok 4.3 as improving agentic performance and lowering pricing, its Omniscience evaluation gives one example of a third-party environment, and Vending-Bench 2, Humanity’s Last Exam, and ARC-AGI-2 define task families rather than just vendor claims.
The safe conclusion is that Grok is publicly competitive on frontier-style capability signals, but public benchmark data cannot answer every business question. Benchmarks do not show uptime, support quality, data-governance fit, human-review burden, or the economics of a real workflow.
xAI Company Scale, Funding, And Compute Context
xAI’s company numbers matter because Grok is expensive to build and run. The official funding trail is clear: $6 billion Series B in May 2024, $6 billion Series C in December 2024, and $20 billion Series E in January 2026. That gives Grok a much stronger financing story than most AI app startups.
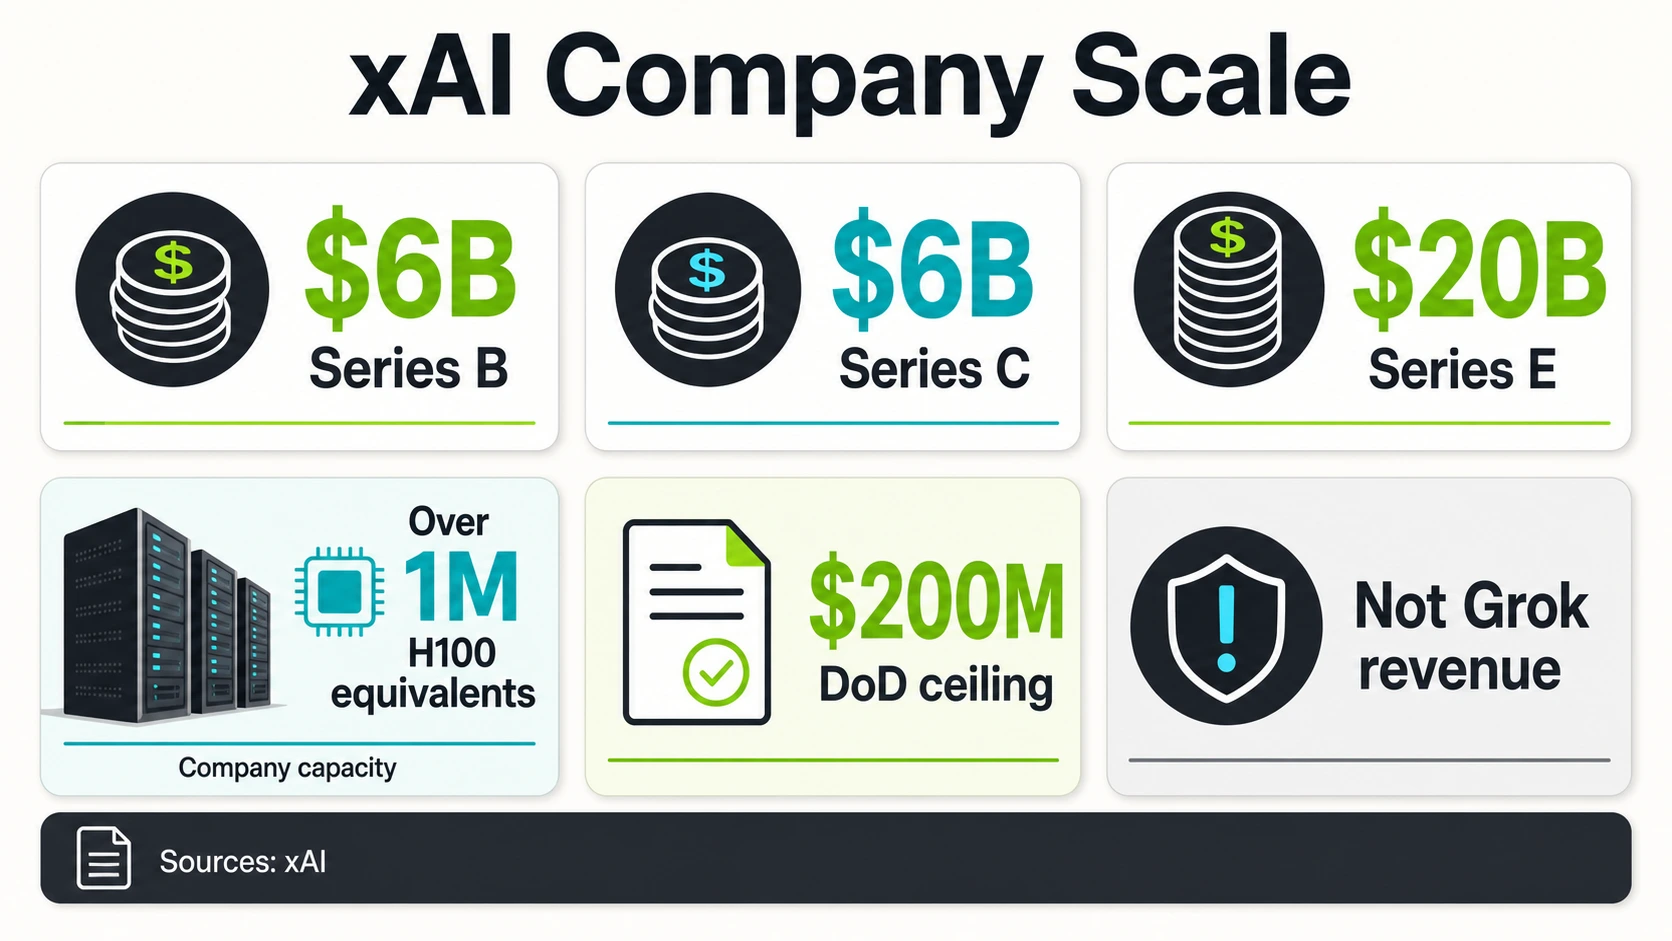
The compute story is just as important. In the Series E announcement, xAI said it started 2024 with about 1,000 training GPUs and ended 2025 with over one million H100 GPU equivalents across Colossus I and II — roughly a thousandfold increase in two years. That is the clearest single explanation for why xAI can keep releasing frontier models such as Grok 4, Grok 4 Fast, and Grok 4.3 on Bedrock.
xAI training GPUs — start of 2024 vs end of 2025
A log axis, because a linear one would flatten 1,000 GPUs to an invisible dot next to 1,000,000+. xAI reports roughly a thousandfold increase in H100-equivalent training capacity across Colossus I and II in two years.
xAIGovernment and enterprise programs round out the company context. xAI announced xAI For Government in July 2025 and cited a $200 million Department of Defense ceiling contract. A ceiling contract is not the same as booked revenue, deployed seats, or active government users. xAI also announced Amazon Bedrock availability in June 2026. The careful reading is “xAI is opening channels where large organizations can buy Grok,” not “xAI has $200 million of realized Grok revenue” or “all AWS customers use Grok.” For operators, funding and compute can reduce platform-risk concerns because they show resources for training, inference, infrastructure, and enterprise sales — but they should not replace product-level measurement.
Market Context: AI Assistants, AI Search, And Enterprise AI
Grok’s public numbers are easier to interpret when placed inside the broader AI assistant and enterprise AI market. The category is expanding fast, but market-wide adoption is not the same as Grok’s market share.
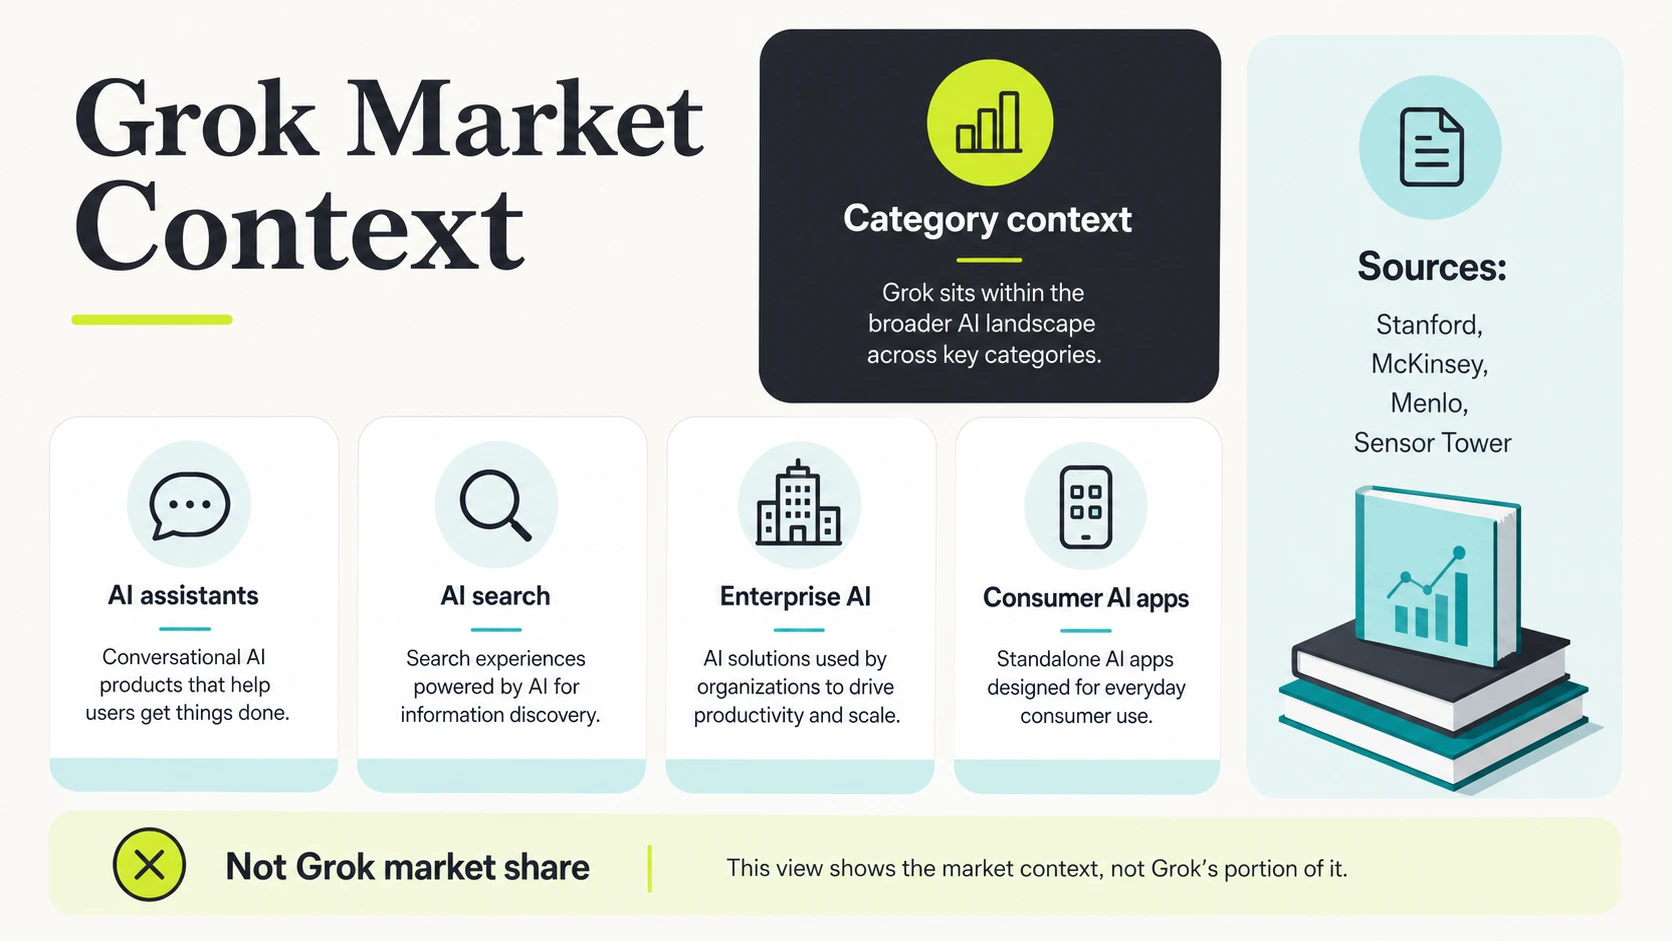
The Stanford AI Index 2026 report and Stanford’s 2026 takeaways show that AI investment, model capability, and public adoption remain major macro themes. Business adoption is also rising: McKinsey’s State of AI research is useful for understanding how companies adopt generative AI, and Menlo Ventures’ enterprise generative AI report gives another view into enterprise spending and model-platform selection. Consumer AI app behavior is a third layer: Sensor Tower’s State of AI 2026 release and report page are useful for generative AI app time spent, downloads, and consumer demand.
Macro context
AI investment & capability
Stanford AI Index 2026 shows AI investment, model capability, and public adoption as major macro themes — context for why Grok’s traffic and API surfaces matter, not a Grok share number.
Stanford HAIEnterprise adoption
How companies adopt AI
McKinsey’s State of AI covers where generative AI value shows up and where governance challenges persist — a category source, not Grok market share.
McKinseyEnterprise spend
Model-platform selection
Menlo Ventures’ enterprise report gives a view into enterprise spending and platform choice; it should not be converted into a Grok share figure.
Menlo VenturesConsumer apps
Time spent on AI apps
Sensor Tower’s State of AI 2026 tracks generative AI app time spent and downloads — context for app-store and web proxies, but its category numbers are not Grok adoption.
Sensor TowerThese are category sources. They explain why Grok’s traffic and API surfaces matter, and why app-store and web-traffic proxies are worth tracking, but none of them measure Grok share. The real Grok story is that xAI is trying to combine X distribution, frontier model performance, API economics, consumer subscriptions, and enterprise procurement into one platform.
Risks, Trust, And Caveats
Trust signals should sit beside the growth numbers. xAI publishes a security page, safety page, acceptable use policy, privacy policy, and terms of service. It also publishes model-card and safety-framework PDFs such as the Grok 4 model card, Grok 4 Fast model card, Grok Code Fast 1 model card, and Frontier AI Framework.
Those documents are not adoption statistics, but they matter for enterprise evaluation. A company choosing Grok through the API, Bedrock, or government offering has to ask how data use, safety controls, acceptable use, model behavior, procurement, and internal review fit its workflow. The existence of a policy page does not eliminate risk; it gives buyers a place to start.
What Grok’s Numbers Mean For Founders And Operators
The practical lesson is not simply that Grok is big. It is that different Grok numbers answer different operating questions, and merging layers is the fastest way to be wrong.
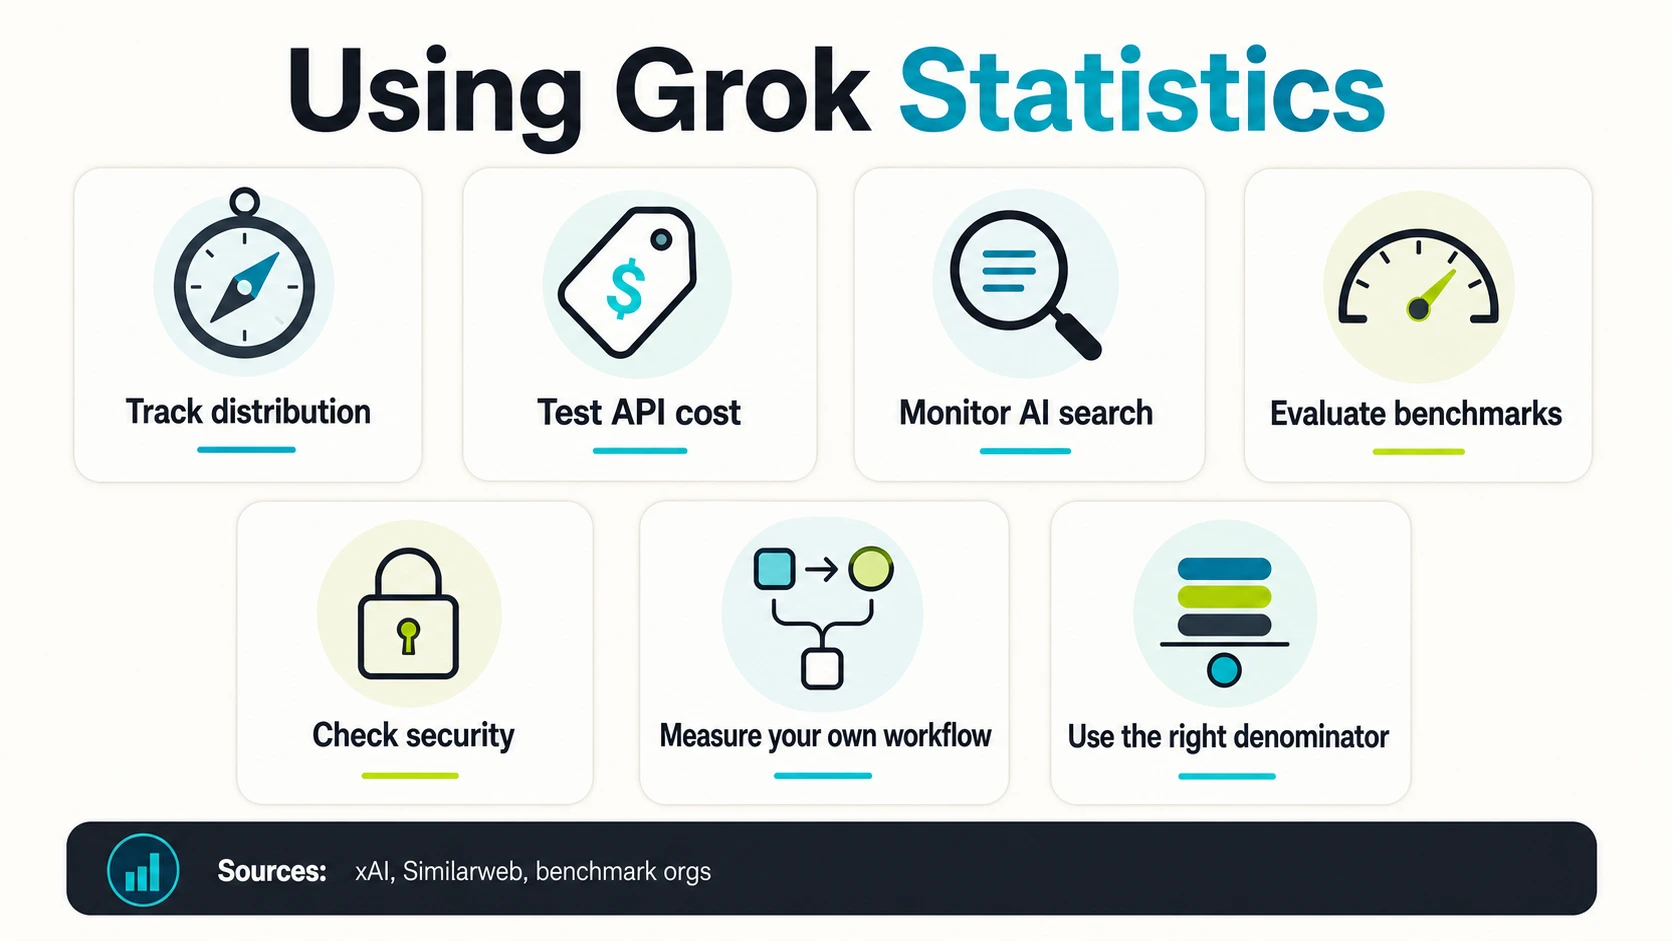
For founders, Grok is a reminder that AI distribution can come from an existing network, not only from a standalone app funnel: xAI’s combined 600 million monthly active reach and X-linked Grok access give it a different starting point. For product teams, the API story is more actionable than broad reach — the models and pricing pages let builders compare context window, token cost, media features, and tool pricing.
GTM view
Track proxies, not one rank
Similarweb’s grok.com estimates suggest a large standalone web audience, and app stores confirm mobile distribution — track referral traffic, AI-search citations, and brand visibility rather than waiting for a perfect audience report.
SimilarwebDeveloper view
Test at the task level
The meaningful comparison is not which model has the biggest benchmark number — it is whether Grok handles your repository context, latency budget, tool calls, review loop, and unit economics.
xAI docsEnterprise view
Channel fit over app-store rank
Amazon Bedrock availability, xAI For Government, security, safety, and official model docs are more useful than consumer download proxies; adoption is decided by procurement, evaluation, integration, risk, and support.
xAIInvestor view
Capacity is not adoption
The Series E reach figure, company financing, and GPU scale support a platform-capacity story; they do not disclose Grok retention, paid conversion, API customer count, or enterprise seat penetration.
xAIFor analysts, the Grok lesson is simple: do not merge layers. A good dashboard can show combined reach, web visits, app distribution, API prices, benchmark scores, funding, GPU scale, and category adoption side by side. A bad dashboard collapses all of those into one “users” number.
A Disciplined Way To Read Grok
Use official xAI pages first for product, model, funding, API, and compute claims: Grok, models, pricing, Series E, Grok 4, Grok 4 Fast, and Grok on Bedrock. Use X help for X-linked access context: About Grok and X Premium. Use app stores and Similarweb for proxy signals, and category sources such as Stanford AI Index, McKinsey, Menlo Ventures, and Sensor Tower for market context.
Frequently Asked Questions
How many users does Grok have in 2026?
xAI said in its January 6, 2026 Series E announcement that it had roughly 600 million monthly active users across X and Grok apps. That is combined reach across X and the Grok apps, not a standalone Grok monthly-active-user count, so it should not be rewritten as "Grok has 600 million monthly active users."
How much web traffic does grok.com get?
Similarweb estimated about 244.9 million visits to grok.com in May 2026, with a global rank of #92, a U.S. AI Chatbots & Tools category rank of #4, 12.93 pages per visit, and an average visit duration of 11 minutes 11 seconds. These are estimated web visits and engagement metrics, not unique users or paid customers.
How much does the Grok API cost?
As accessed on July 4, 2026, xAI’s developer docs listed Grok 4.3 at a 1 million token context window with pricing of $1.25 per 1 million input tokens and $2.50 per 1 million output tokens. API pricing is a cost signal for builders, not a measure of usage volume or revenue.
How much funding has xAI raised?
xAI announced $20 billion in Series E financing on January 6, 2026, following a $6 billion Series B in May 2024 and a $6 billion Series C in December 2024. These are company financing figures; they do not prove Grok product revenue.
How many GPUs does xAI have?
In its Series E announcement, xAI said it began 2024 with about 1,000 training GPUs and ended 2025 with over one million H100 GPU equivalents across Colossus I and Colossus II. That is a compute-capacity statistic, not a user statistic, and it does not measure live utilization.
How well does Grok score on benchmarks?
xAI said Grok 4 Heavy scored 50.7% on the text-only subset of Humanity’s Last Exam with tools and 15.9% on ARC-AGI-2, per the Grok 4 page. These are benchmark scores under defined test setups, not production success rates or proof of real-world ROI.
Is Grok available for enterprises and government?
xAI announced Grok on Amazon Bedrock on June 17, 2026, bringing Grok 4.3 to AWS’s managed model marketplace, and announced xAI For Government on July 14, 2025 with a $200 million Department of Defense ceiling contract. A Bedrock listing and a ceiling contract are distribution and procurement signals, not counts of deployed teams, booked revenue, or active government users.
Does xAI publish standalone Grok monthly active users or revenue?
No. Public sources do not appear to disclose standalone Grok MAU, paid Grok subscribers, Grok revenue, API active developers, retention, or Grok market share. The public statistics are combined reach, web-traffic estimates, app distribution, API pricing, benchmark scores, funding, and compute — each with its own denominator.
Sources and Further Reading
Official xAI product, funding & compute
API docs, distribution & app listings
Benchmarks & independent evaluations