AI Chatbot Statistics
Last updated on July 9, 2026

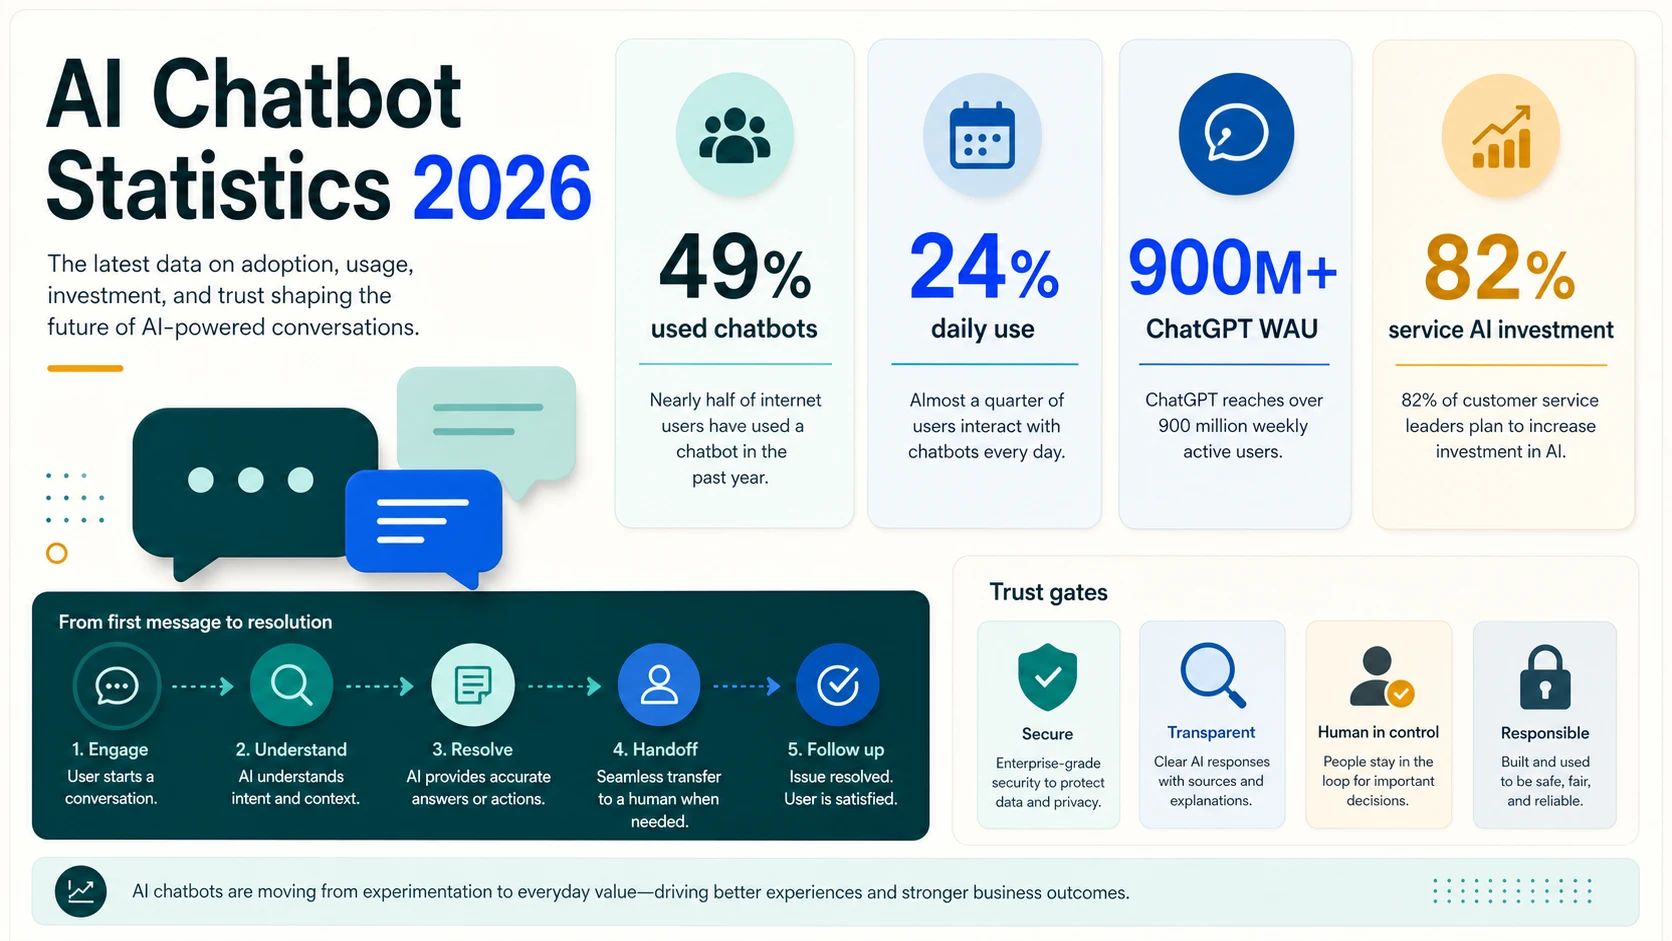
AI chatbots have moved from novelty to infrastructure. In 2026 they sit inside consumer apps, search results, customer-service flows, workplace suites, education tools, and developer platforms. The hard part is no longer proving that people use them — it is reading the numbers without mixing unlike metrics.
A survey percentage is not the same thing as a weekly active user count. A website visit is not the same thing as a person. A paid workplace seat is not the same thing as an active support bot. A chatbot market forecast is not a deployment count. Once those denominator lines are clear, the shape of the market is much easier to see: consumer usage is mainstream, daily habit is still smaller than awareness, product ecosystems are scaling fast, customer-service deployment is the clearest enterprise use case, and trust remains the main constraint on how far chatbots can go.
The AI Chatbot Landscape In 2026
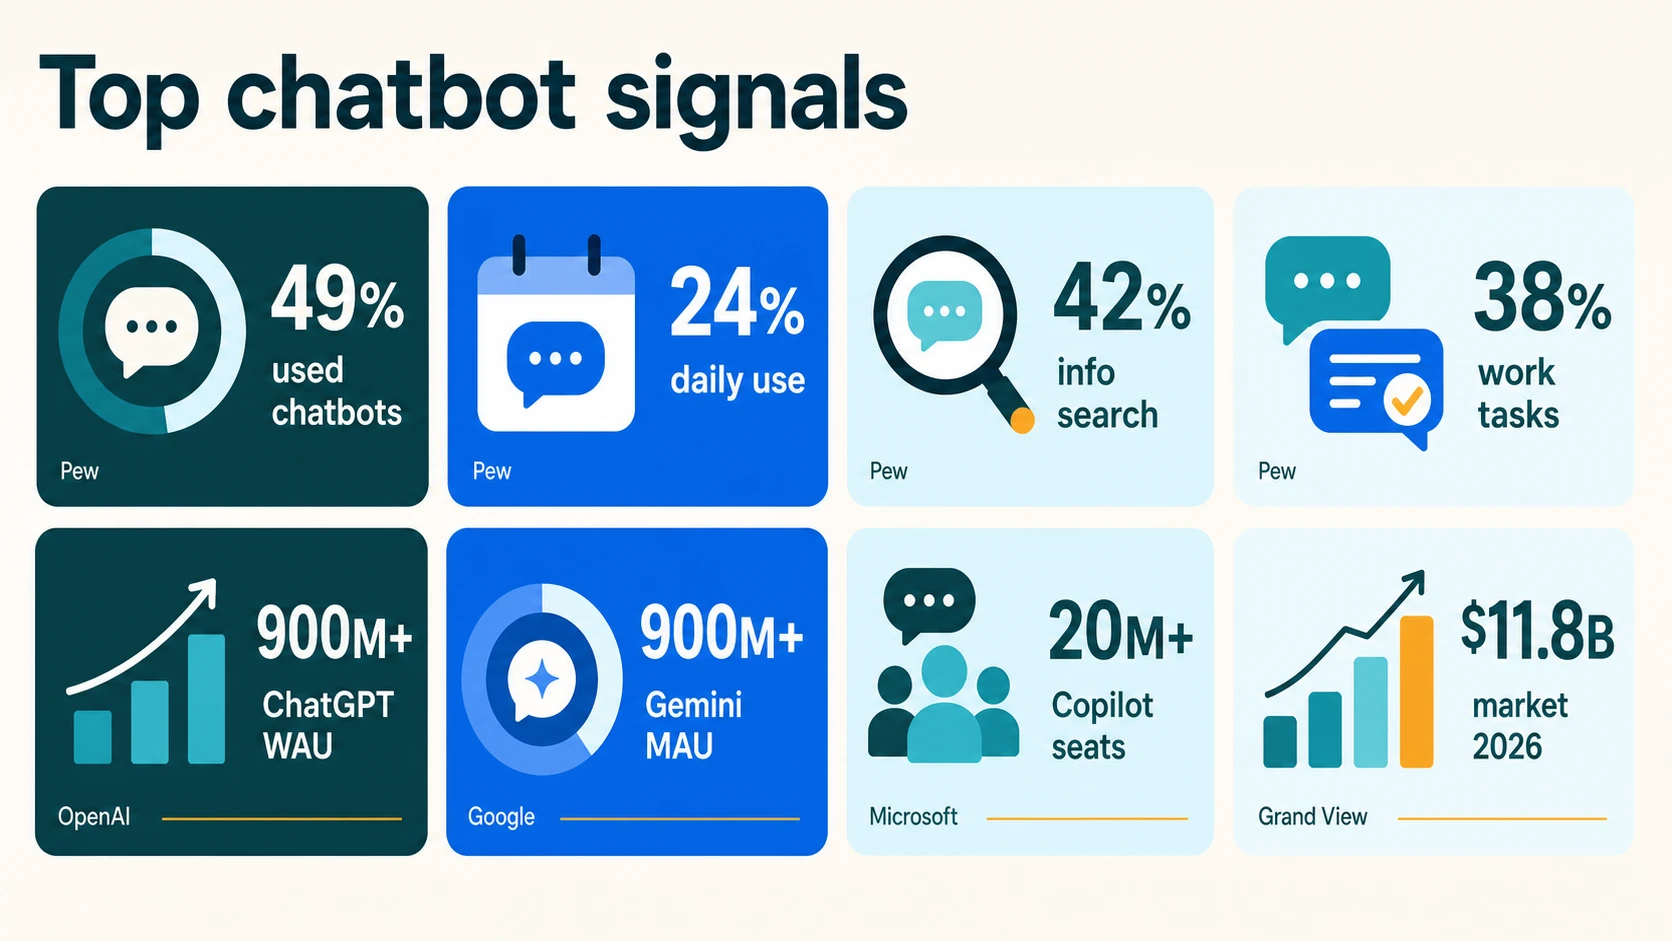
The headline chatbot numbers use different denominators, so read them as separate consumer, product, deployment, and market signals rather than one figure.
Consumer adoption & attitudes (surveys)
Product scale & market (official disclosures and forecasts)
Read every number by its own denominator
The headline chatbot figures answer different questions. Tap a category to see what it measures — and what it does not prove.
Pew, OpenAI, Similarweb, Intercom, Grand View ResearchConsumer Adoption: Chatbots Are Mainstream, But Daily Habit Is Narrower
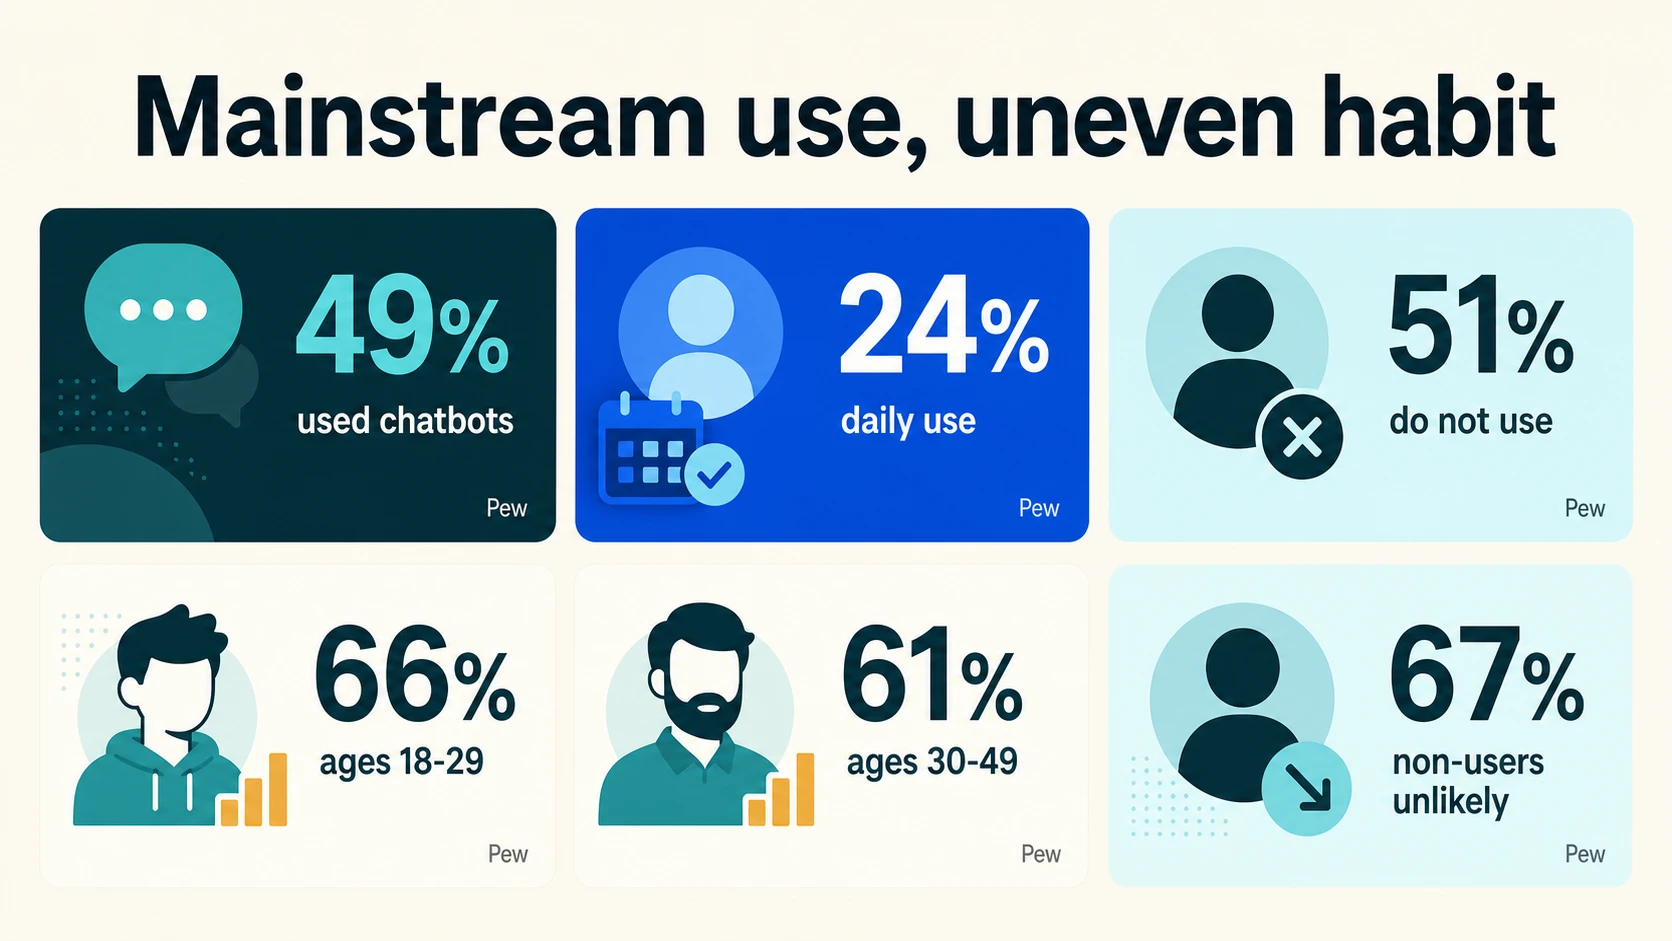
The clearest consumer adoption number in 2026 is Pew’s finding that 49% of U.S. adults have used AI chatbots. That puts chatbot use close to a mass-market threshold. It also explains why business leaders, publishers, educators, and support teams can no longer treat chatbots as a niche technical habit.
But “used” is not the same as “uses every day.” Pew’s frequency data shows 24% of U.S. adults use AI chatbots daily, while 25% use them several times a week or less and 51% do not use them. The gap between 49% ever-use and 24% daily use is the most important consumer adoption caveat: chatbot familiarity is already mainstream, but durable habit still depends on task fit.
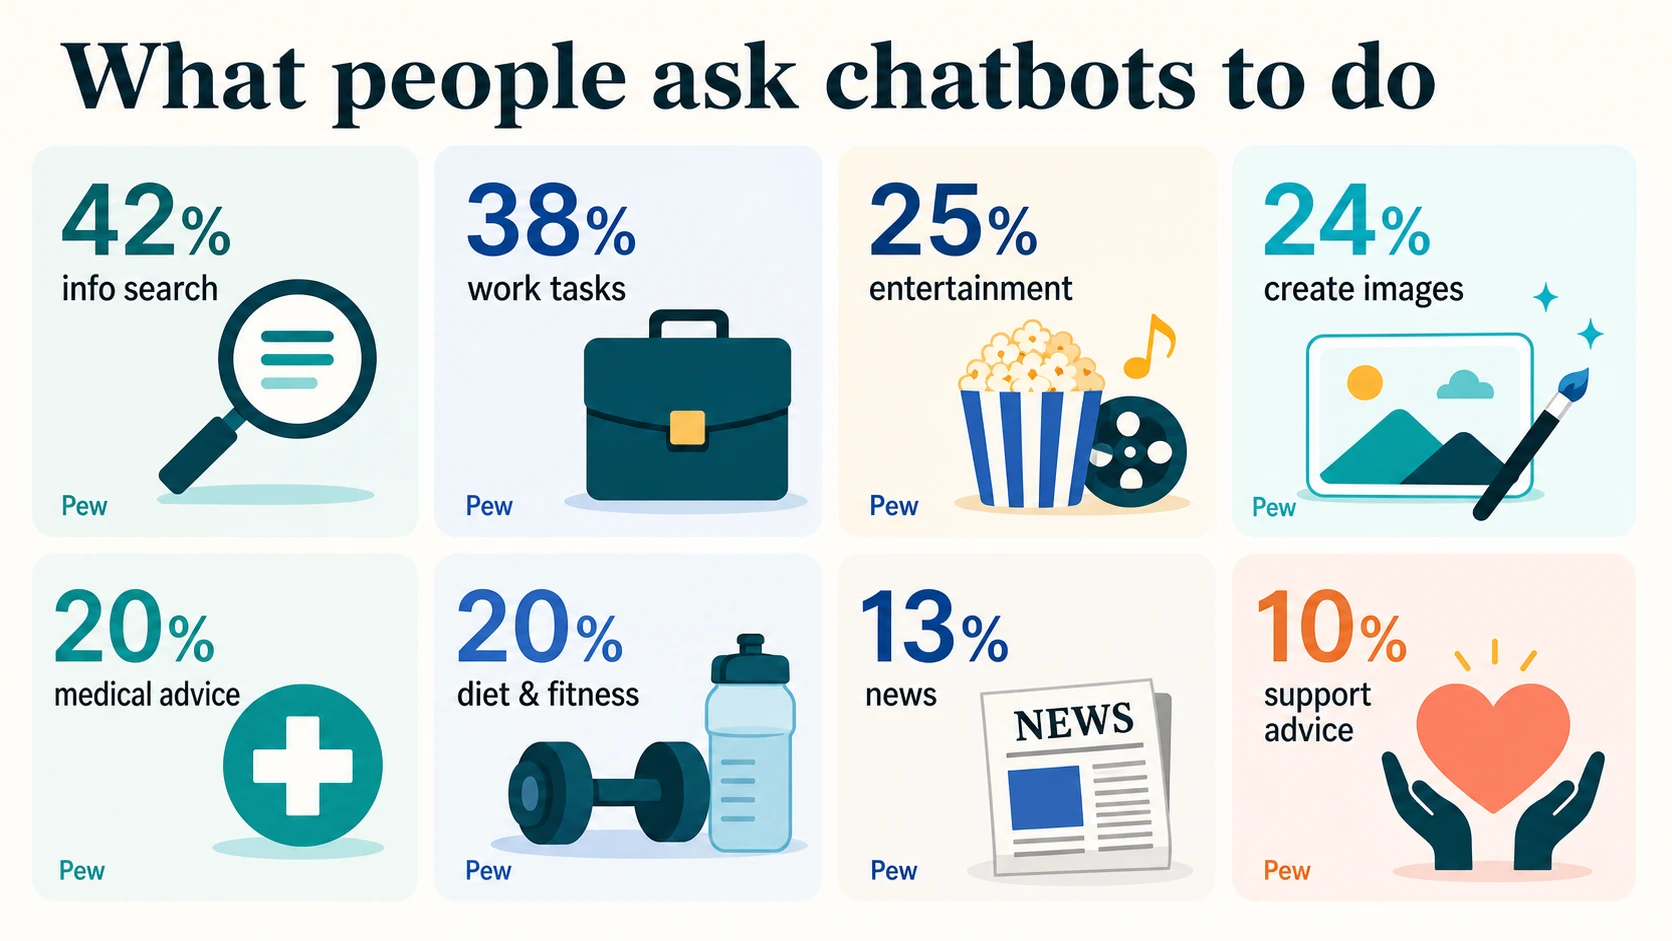
The use-case breakdown makes that task fit visible. Information searching leads at 42% of U.S. adults. Work tasks reach 38% among employed adults. Entertainment, image and video creation, medical advice, diet or fitness advice, news, emotional support, and companionship all appear, but at lower levels. Chatbots are not one use case — they are a general interface that users pull into search, writing, decisions, creativity, and personal questions.
Age tells the same story from another angle. Pew finds 66% of U.S. adults ages 18-29 have used chatbots, as have 61% ages 30-49. Adoption drops to 42% among ages 50-64 and 23% among ages 65+. That gradient helps explain why universities, entry-level workplaces, creator tools, coding tools, and mobile-first consumer products feel the impact earlier than older-adult services.
The non-user base is resistant, not merely unaware. Among adults who do not use chatbots, Pew reports 67% are not too or not at all likely to use them in the next year. That suggests the next adoption wave may come less from asking people to start a new chatbot habit and more from embedding AI assistants into existing workflows — search pages, help centers, productivity suites, and mobile apps.
Education and youth behavior are another adoption channel. Pew’s AI topic coverage says just over half of U.S. teens have used chatbots for schoolwork, while 12% have used them for emotional support. Those numbers matter because schoolwork and emotional support are both high-stakes contexts. They show why adoption data has to be paired with accuracy, disclosure, and safety expectations.
The information-use story is especially delicate. Reuters Institute reports that weekly AI chatbot use for news reached 10% globally, up from 7%, but only 1% say AI is their main news source. Chatbots are becoming part of the news and information journey, yet they remain a supplement for most users rather than the primary destination.
Product Ecosystem: ChatGPT Leads, But The Category Is Broader
ChatGPT remains the strongest official product-scale signal in the market. OpenAI says ChatGPT has more than 900 million weekly active users, more than 50 million consumer subscribers, and more than 9 million paying business users. Those numbers make ChatGPT one of the largest recurring software habits in the world.
OpenAI’s product is also becoming more global. In its adoption analysis, OpenAI says non-English usage is now more than half of active users. That matters because early chatbot narratives were often skewed toward English-speaking professionals, students, and developers. The current market is more international, and chatbot use cases increasingly include translation, local research, administrative tasks, education, commerce, and everyday problem solving.
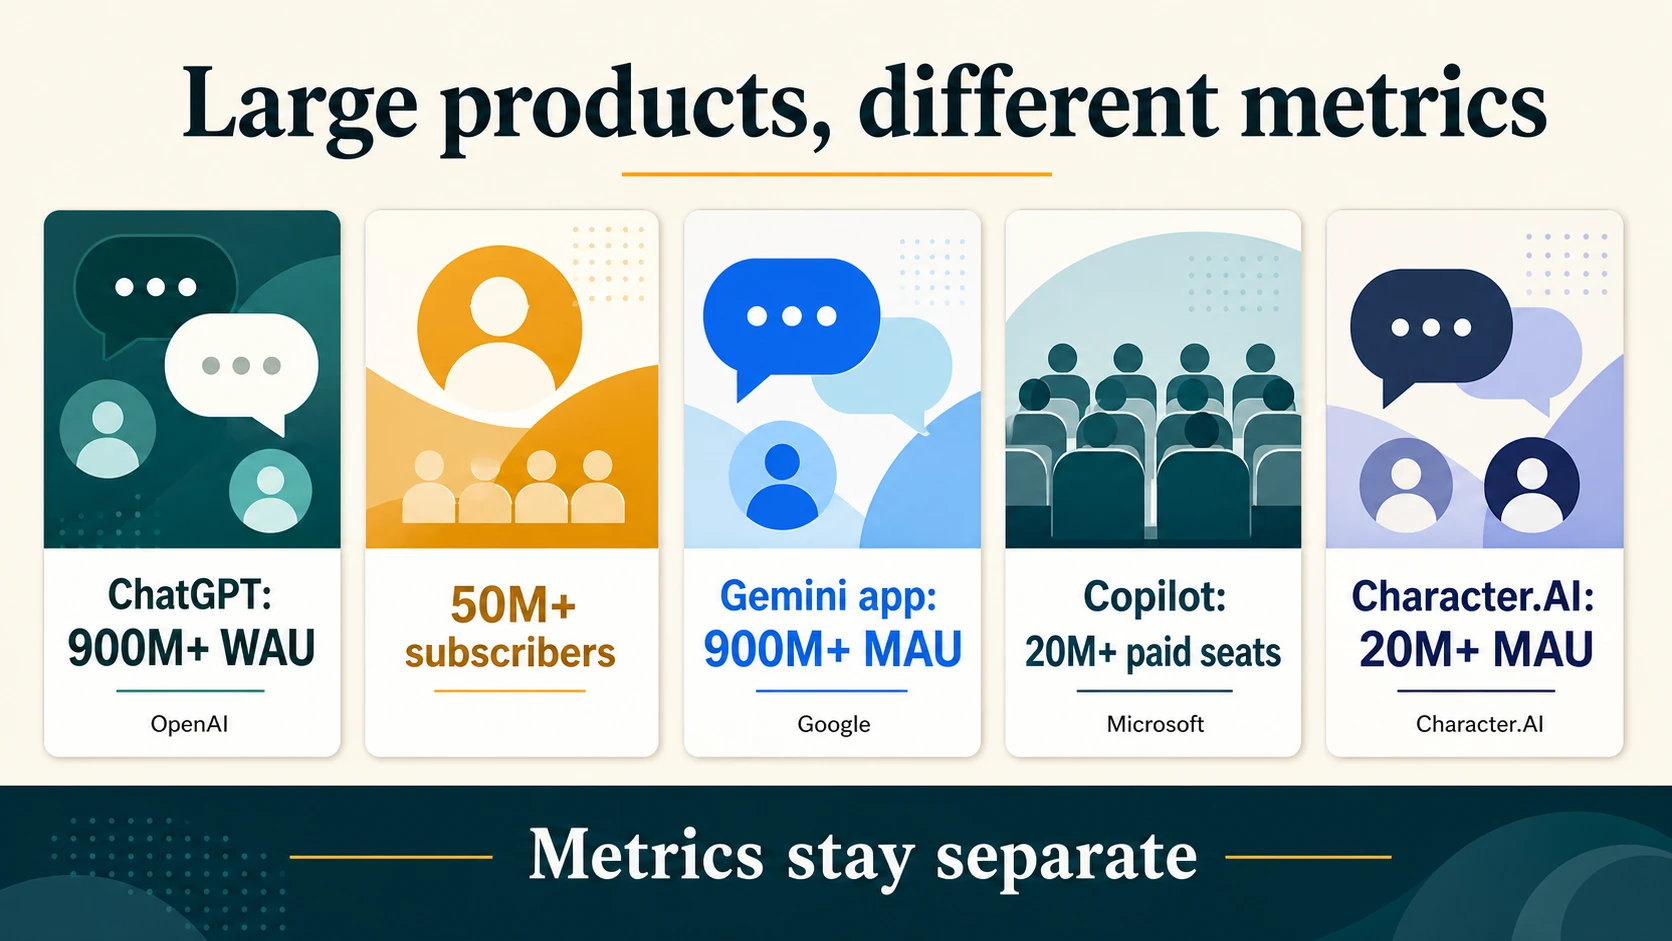
Headline product scale — but note the units
Each bar is drawn to the value shown; the labels underneath name the metric, because a weekly-active user, a monthly-active user, a paid seat, and a subscriber are not the same unit. Do not add these bars together.
OpenAI, Google, Microsoft, Character.AIOpenAI’s historical usage paper adds a useful intensity benchmark. By July 2025, ChatGPT had 700 million weekly users sending 18 billion messages per week. That equates to billions of daily interactions, but it should be dated carefully because OpenAI’s current disclosed weekly-user number is higher and the current message count is not disclosed in the same way.
Google’s Gemini app is the other major official consumer-scale signal. Google says the Gemini app has more than 900 million monthly active users, up from earlier levels disclosed in 2025. Google also says AI Overviews reaches more than 2.5 billion monthly users and AI Mode reaches more than 1 billion monthly users. Those search numbers are not chatbot numbers, but they show how AI answer interfaces are moving into the default search experience.
Microsoft’s scale is different because it is tied to paid work seats. Microsoft says Microsoft 365 Copilot has more than 20 million paid seats, while nearly 90% of Fortune 500 companies have active agents built with low-code/no-code tools. That places enterprise assistant adoption inside the productivity-suite layer, where the interface may look like chat but the metric is seat-based, admin-managed, and workflow-driven.
Character.AI proves that consumer chatbot demand is not only about productivity. The company says it supports more than 20 million monthly active users across its services. That specialized social/character use case sits beside general assistants like ChatGPT and Gemini, workplace copilots like Microsoft 365 Copilot, and customer-support bots embedded in websites and apps.
Enterprise And Customer-Service Chatbot Statistics
Customer service is the clearest enterprise deployment lane because the workflow already has structured conversations, repetitive questions, escalation paths, and measurable outcomes. Intercom says 82% of senior leaders invested in AI for customer service in the past 12 months, and 87% plan to invest in 2026. But only 10% say deployment is mature, fully integrated, and at scale.
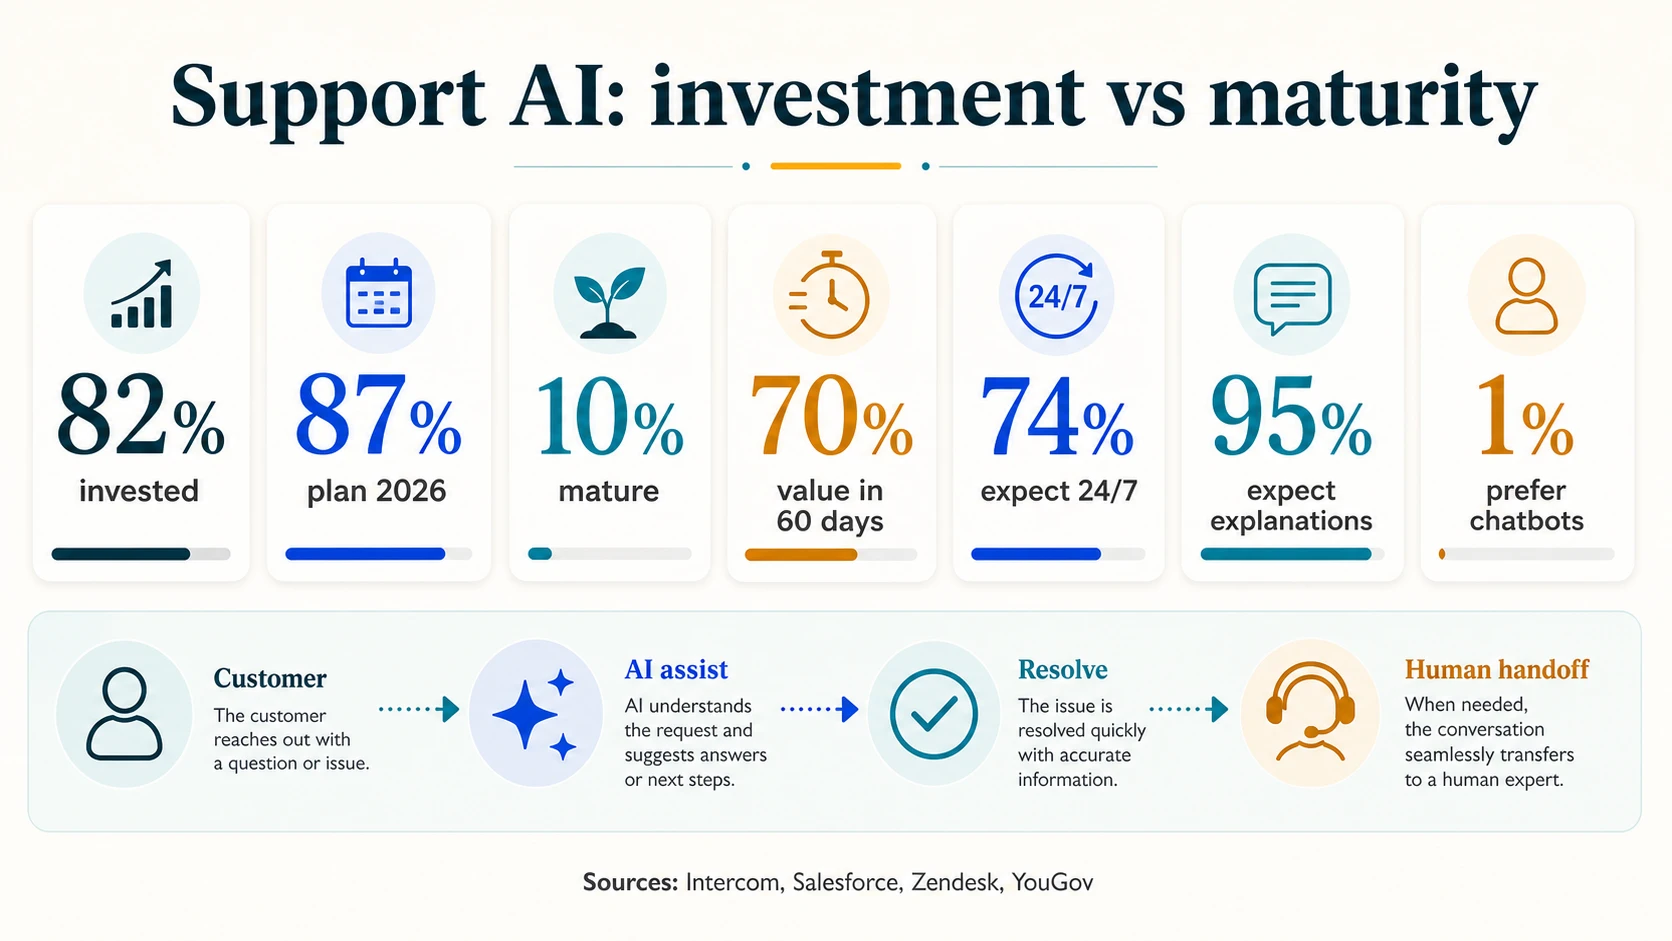
That maturity gap may be the single best enterprise chatbot statistic. It explains why the market can feel simultaneously urgent and unfinished. Companies are buying, testing, piloting, and deploying AI service systems, but mature operating models are still rare. A support team can have an AI bot live on a site and still lack complete knowledge-base coverage, QA review, escalation design, analytics, agent training, and governance.
Salesforce’s customer-service research points to early value. Salesforce says 70% of organizations with AI service agents observe measurable value within 60 days. It also says 89% of service professionals with AI agents believe their organizations would benefit from expanding use, and 97% of customer-service leaders with AI say it affects workforce planning. That is strong evidence that service AI has moved from experimentation into operational planning.
Zendesk’s data shows why deployment cannot be judged only by automation rate. Its CX Trends research says 74% of consumers expect 24/7 customer service because of AI. Its 2026 CX Trends press release says 95% of consumers expect an explanation when AI makes a decision, and 80% of CX leaders believe AI transparency will be required within two years. Faster response is not enough if customers do not understand or trust the decision path.
YouGov adds a practical counterweight. Nearly 70% of Americans tend to use phone support, 35% prefer phone, 18% have used chatbots, and only 1% prefer them. Customer-service chatbots therefore have to earn their place through speed, resolution quality, and easy handoff. For many customers, the desired future is not “never speak to a human.” It is “solve the issue quickly, and let me reach a human when needed.”
IBM’s customer-service material frames the outcome side. IBM says mature AI adopters in customer service reported 17% higher customer satisfaction, while its AI customer-service chatbot explainer defines chatbots as systems that use AI to simulate human conversation across text or voice channels. IBM also highlights case examples, such as Camping World’s virtual assistant increasing engagement and reducing wait times. Those examples are useful, but they should be read as cases, not industry averages.
Gartner’s forecast shows the ambition level. It predicts agentic AI will autonomously resolve 80% of common customer-service issues by 2029, with 30% operational cost reduction. That is not a 2026 current-state statistic. It is a forecast that shows where vendors and CX leaders expect support automation to go.
The enterprise picture is therefore not “chatbots replace support teams.” It is more specific: AI chatbots and service agents are being used to answer repetitive questions, guide customers, summarize context, assist human agents, classify intent, pull from knowledge bases, route cases, and automate low-risk steps. The strongest programs measure resolution, escalation quality, CSAT, containment, first-contact resolution, handle time, agent productivity, and customer trust together.
Market Size And Revenue Forecasts
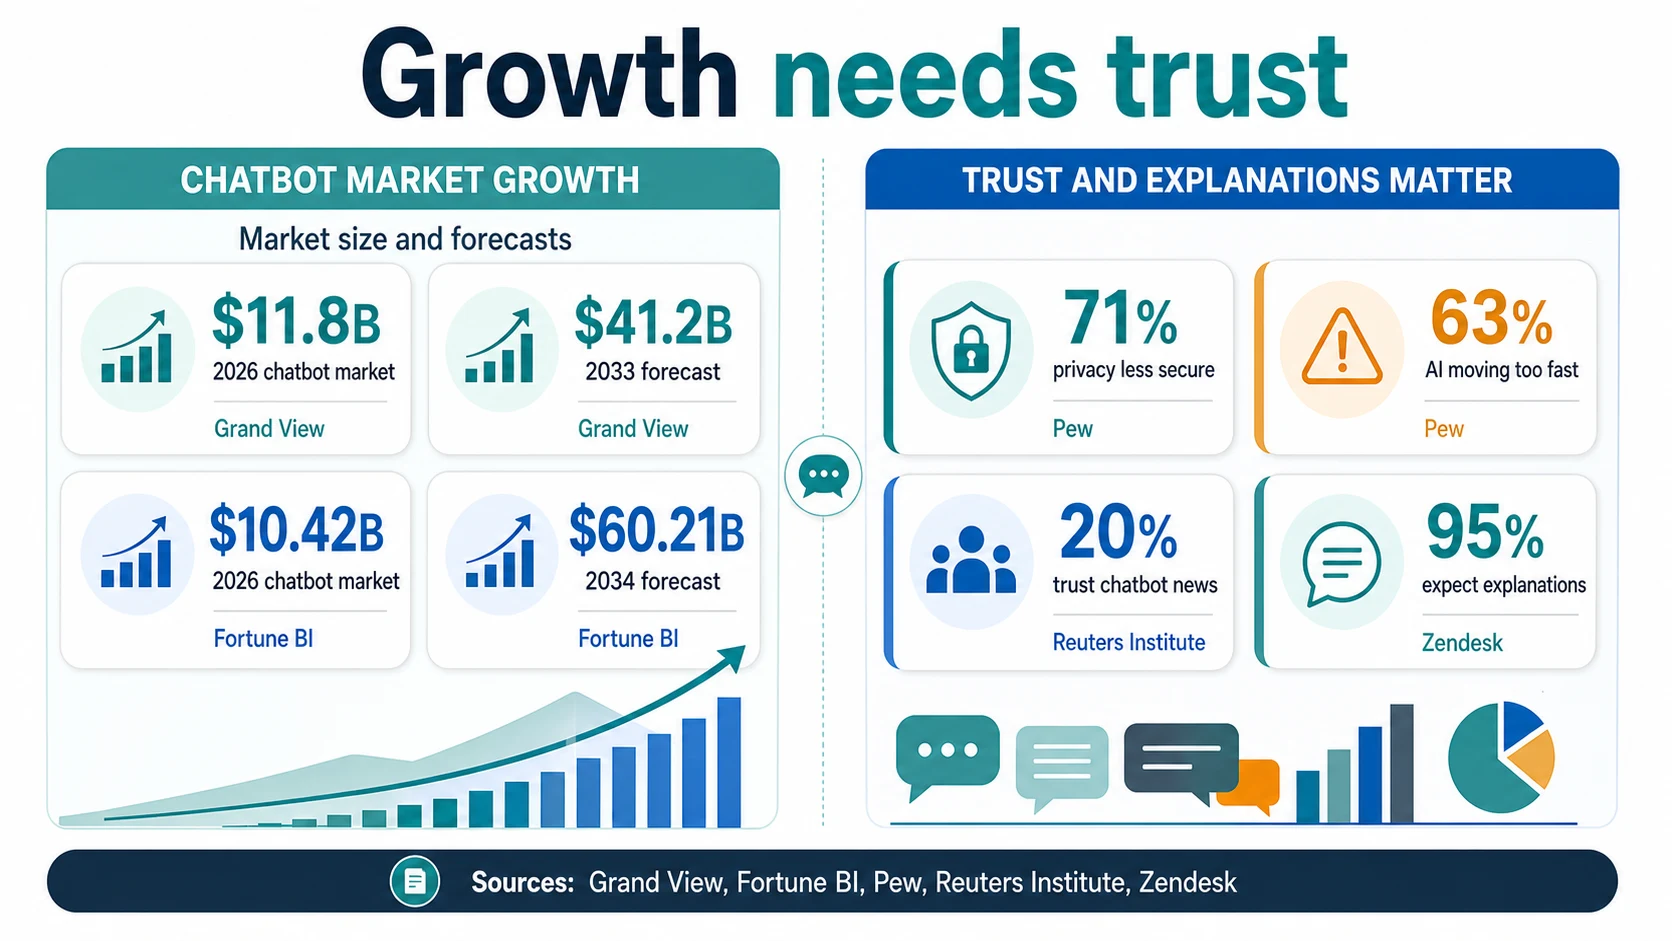
The chatbot market is growing quickly, but market-size forecasts vary because definitions vary. Grand View Research estimates the global chatbot market at $11.8 billion in 2026, up from $9.6 billion in 2025, and projects $41.2 billion by 2033 at a 19.6% CAGR. It also identifies North America as the largest regional revenue share at 31.3% in 2025.
Fortune Business Insights projects a similar 2026 starting point but a larger long-range market. Its chatbot market forecast puts the category at $10.42 billion in 2026 and $60.21 billion by 2034, implying 24.51% CAGR. Its generative AI chatbot market forecast is larger and faster, from $12.98 billion in 2026 to $113.35 billion by 2034.
Those numbers should be read as spend and revenue signals, not adoption rates. Market revenue grows when companies pay for software, APIs, enterprise seats, implementation, integrations, and support automation. Consumer use can grow without equivalent revenue if usage is free. Enterprise revenue can grow even when the number of deployed bots is modest, if large companies buy expensive platforms. A market forecast tells readers that money is moving into the category. It does not reveal how many people successfully resolved a support issue with a bot yesterday.
The split between “chatbot,” “generative AI chatbot,” “conversational AI,” and “customer-service AI” will keep creating confusion. A traditional rule-based website bot, a generative customer-service agent, a sales assistant, a knowledge-base copilot, a voice agent, and a general-purpose consumer chatbot may all appear in related market forecasts. The cleanest way to use market data is to cite the forecast scope, keep the provider’s definition visible, and avoid averaging estimates into a fake consensus.
Traffic, Apps, And The Difference Between Visits And Users
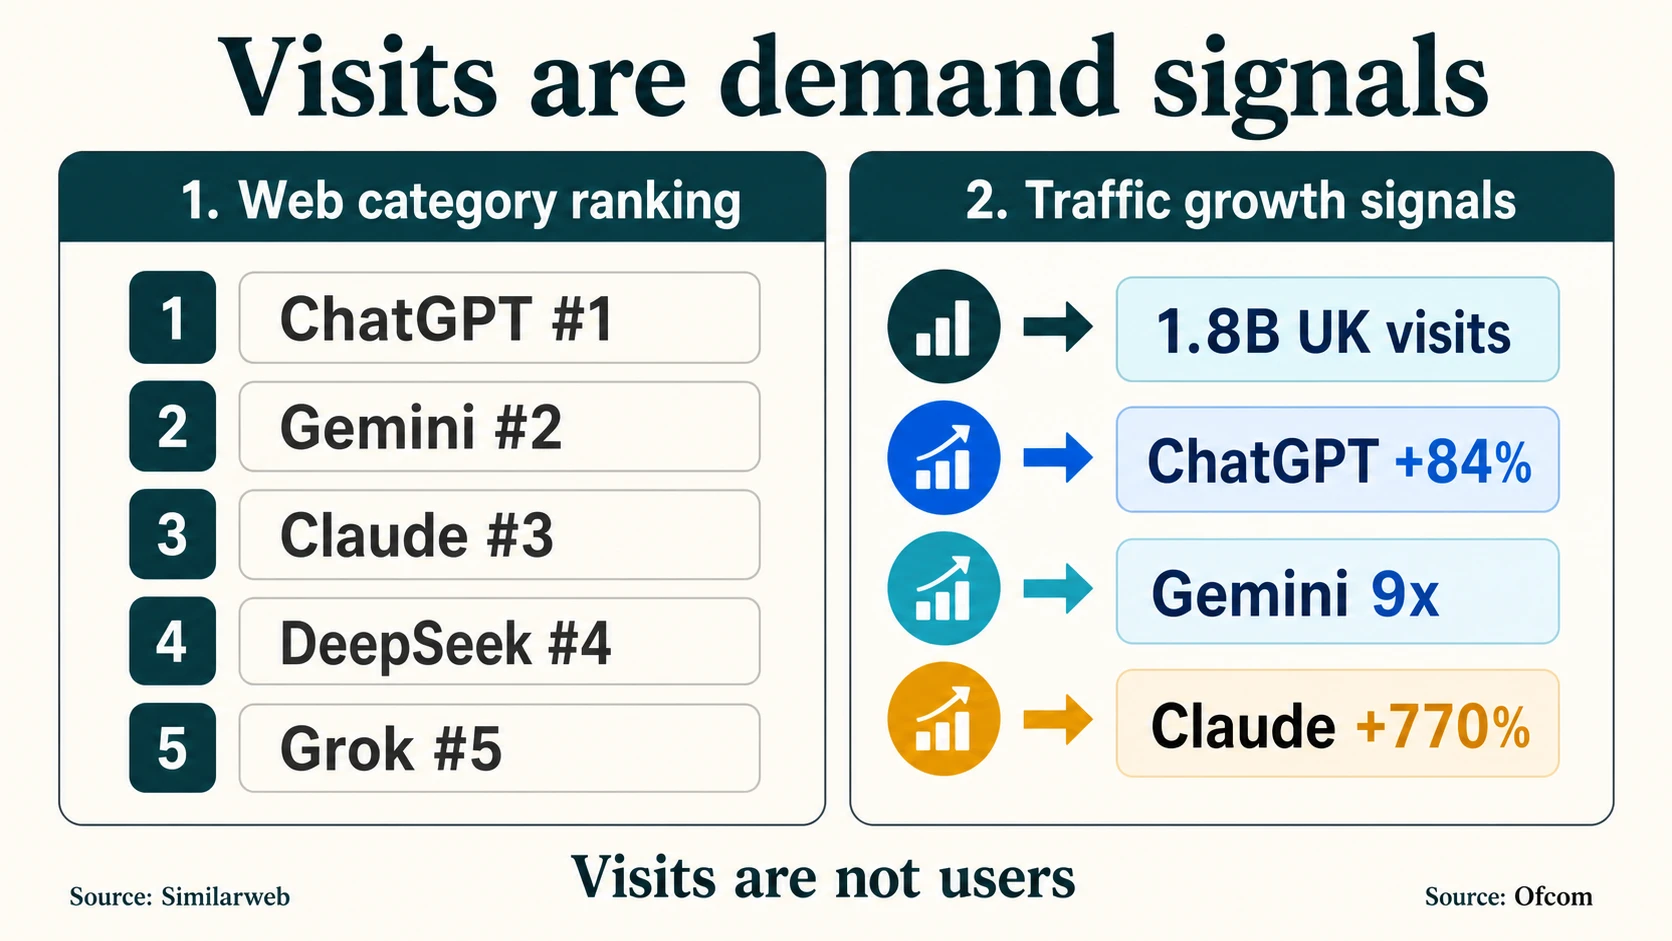
Traffic data is valuable because it captures behavior that surveys and company disclosures may miss. Similarweb’s category ranking shows which chatbot websites are drawing large volumes of web attention. In May 2026 it ranked chatgpt.com #1, gemini.google.com #2, claude.ai #3, chat.deepseek.com #4, and grok.com #5 in its AI Chatbots and Tools category. Its generative AI analysis shows that ChatGPT, Gemini, Claude, Perplexity, and Grok all gained traffic or app momentum across different windows.
chatgpt.com
Ranked #1 in Similarweb's AI Chatbots and Tools category in May 2026, with estimated web visits up about 84% from September 2024 to March 2026.
gemini.google.com
Ranked #2, with Similarweb estimating Gemini web visits grew roughly 9x over a comparable window — the sharpest challenger momentum.
claude.ai
Ranked #3 in the category, part of a broader competitive web set alongside DeepSeek and Grok.
chat.deepseek.com
Ranked #4, showing that the category is not a two-horse race in raw web traffic.
grok.com
Ranked #5, rounding out the top five AI chatbot web destinations by Similarweb estimate.
Ofcom’s UK data is an especially clear example of traffic momentum. ChatGPT had 1.8 billion UK visits in the first eight months of 2025, compared with 368 million in the same period of 2024. That is a huge behavioral signal — but it is not a user count. The UK does not have 1.8 billion people; the number reflects repeated visits.
For marketers and publishers, traffic signals matter because they show where attention and referrals may shift. For product teams, they show competitive momentum. For investors, they show demand. But traffic data is weakest when it is used to estimate exact active-user counts or category market share without disclosure from the product itself.
The same caution applies to app signals. App monthly users, downloads, rankings, and session growth can be useful, but they often come from panel estimates or app-store rankings. They can miss web usage, enterprise usage, embedded usage, and multi-device behavior. Official user disclosures from OpenAI, Google, Microsoft, or other providers should anchor product scale whenever available; traffic and app data should add directional color.
Trust, Safety, And User Expectations
Adoption is rising faster than confidence. Pew reports that 63% of U.S. adults think AI is advancing too quickly. It also finds 71% believe increased AI use will make personal information less secure, 67% have little or no confidence in the U.S. government’s ability to regulate AI effectively, and 59% are not confident that companies will develop and use AI responsibly.
Those numbers matter because chatbots ask for trust in a very direct way. Users type private questions into them. Employees upload documents. Customers describe problems. Students ask for guidance. Patients may ask medical-adjacent questions. Shoppers may share order details. A chatbot interface can feel conversational, which makes it easier for users to disclose sensitive context.
The trust problem is not only about privacy. It also includes accuracy, hallucinations, source quality, tone, escalation, recordkeeping, and explainability. Reuters Institute’s 20% global trust in AI chatbot news shows that information users are cautious. Zendesk’s finding that 95% of consumers expect explanations shows the same pressure in customer service.
NIST’s AI Risk Management Framework is useful because it shifts the conversation from “how many users” to “what makes an AI system trustworthy.” For chatbot operators, that means tracking more than volume. Useful operational metrics include fallback rates, escalation success, unsupported-intent rates, answer accuracy, complaint rates, privacy incidents, human review coverage, and user satisfaction by task.
Trust also explains why customer-service chatbot adoption can rise while customers still prefer phone or human channels. YouGov’s channel-preference data shows that chatbot use does not automatically equal chatbot preference. A chatbot that resolves routine issues quickly can be welcome. A chatbot that blocks escalation, invents policy, or repeats scripted answers becomes a liability.
How Not To Misread The Chatbot Numbers
The safest way to interpret chatbot statistics is to start with the denominator. Pick the source type below to see what its numbers are good for — and what they are not.
Match the number to the source type
Describe surveyed people and their self-reported behavior. Excellent for adoption, frequency, use cases, demographics, and attitudes.
Describe a named product or product suite. Excellent for product reach, but not comparable across companies because weekly users, monthly users, subscribers, paid seats, and agents are different units.
Describe visits, rankings, or traffic. Useful for demand and attention. Should not become a count of people, because visits are repeated sessions.
Describe customer-service teams, leaders, consumers, or service outcomes. Useful for enterprise deployment and CX strategy. May include support automation beyond text chatbots.
Describe a revenue market. Useful for investment and vendor-market context. Does not prove adoption, active usage, or product superiority — and definitions vary between reports.
Every chatbot statistic belongs to a source family with its own strengths and blind spots. Tap a family to see how to read it.
Pew, OpenAI, Similarweb, Intercom, Grand View ResearchConsumer
Broad exposure, narrower habit
Pew's 49% ever-use shows chatbots are mainstream; the 24% daily figure shows the smaller group that has turned them into a habit. The opportunity is recurring value in specific tasks.
PewProduct
A multi-polar market
ChatGPT has enormous weekly reach, Gemini has enormous app reach, Copilot has paid workplace scale, and Character.AI has specialized consumer usage — each a different unit.
OpenAIEnterprise
Fastest where outcomes are measurable
Customer service has queues, intents, handle time, escalation, and resolution metrics — which is why Intercom, Salesforce, and Zendesk data beats broad "businesses use AI" claims.
IntercomMarket
Upward, but not a clean adoption forecast
Grand View's $11.8B, Fortune's $10.42B, and Fortune's $12.98B generative estimates all point upward — they just define the market differently.
Grand View ResearchStanford HAI adds category context from a different denominator again: it says generative AI reached 53% population adoption within three years, with country-level variation including 61% in Singapore and 28.3% in the U.S. That is broader generative AI adoption, not the same denominator as Pew’s U.S. chatbot-specific survey, and the two should not be equated.
Frequently Asked Questions
How many people use AI chatbots in 2026?
Pew Research Center found that 49% of U.S. adults have used AI chatbots such as ChatGPT, Gemini, or Copilot, but only 24% use one daily and 51% do not use them at all. This is a U.S. survey of self-reported behavior, not a global active-user count.
How many users does ChatGPT have?
OpenAI says ChatGPT has more than 900 million weekly active users, more than 50 million consumer subscribers, and more than 9 million paying business users. Weekly active users, subscribers, and business users are different units and should not be added together.
How many monthly active users does the Gemini app have?
Google says the Gemini app has more than 900 million monthly active users, according to its Google I/O 2026 materials. Google separately says AI Overviews reaches more than 2.5 billion monthly users, but those are AI search surfaces, not standalone chatbot usage.
How big is the AI chatbot market?
Grand View Research estimates the global chatbot market at $11.8 billion in 2026, rising to $41.2 billion by 2033. Fortune Business Insights projects $10.42 billion in 2026 for chatbots and $12.98 billion for generative AI chatbots; the figures differ because each report defines the market differently.
Do people actually prefer chatbots for customer service?
Not yet. YouGov found that nearly 70% of Americans tend to use phone support and only 1% prefer chatbots for customer service, even though 18% have used them. Chatbots earn their place through fast resolution and easy handoff to a human, not by replacing every channel.
How much have companies invested in AI for customer service?
Intercom reports that 82% of senior leaders invested in AI for customer service in the past 12 months and 87% plan to invest in 2026, but only 10% describe their deployment as mature, fully integrated, and at scale. Intent runs well ahead of mature operating models.
Do people trust AI chatbots?
Trust remains low. Reuters Institute reports 20% global trust in news from AI chatbots (rising to 44% among chatbot users), while Pew finds 71% of U.S. adults think more AI use will make personal information less secure and Zendesk finds 95% of consumers expect an explanation when AI makes a decision.
Why do AI chatbot statistics disagree with each other?
Because they use different denominators. A Pew survey percentage, an OpenAI weekly-active-user count, a Similarweb visit estimate, a Microsoft paid-seat total, and a Grand View revenue forecast measure different things — surveyed people, product reach, web sessions, licenses, and spend — so they cannot be compared or added directly.
Sources and Further Reading
Consumer adoption & attitudes (surveys)
Product scale (official disclosures)
Traffic, apps & market forecasts
Customer service, trust & governance