Amazon Seller Statistics
Last updated on July 7, 2026

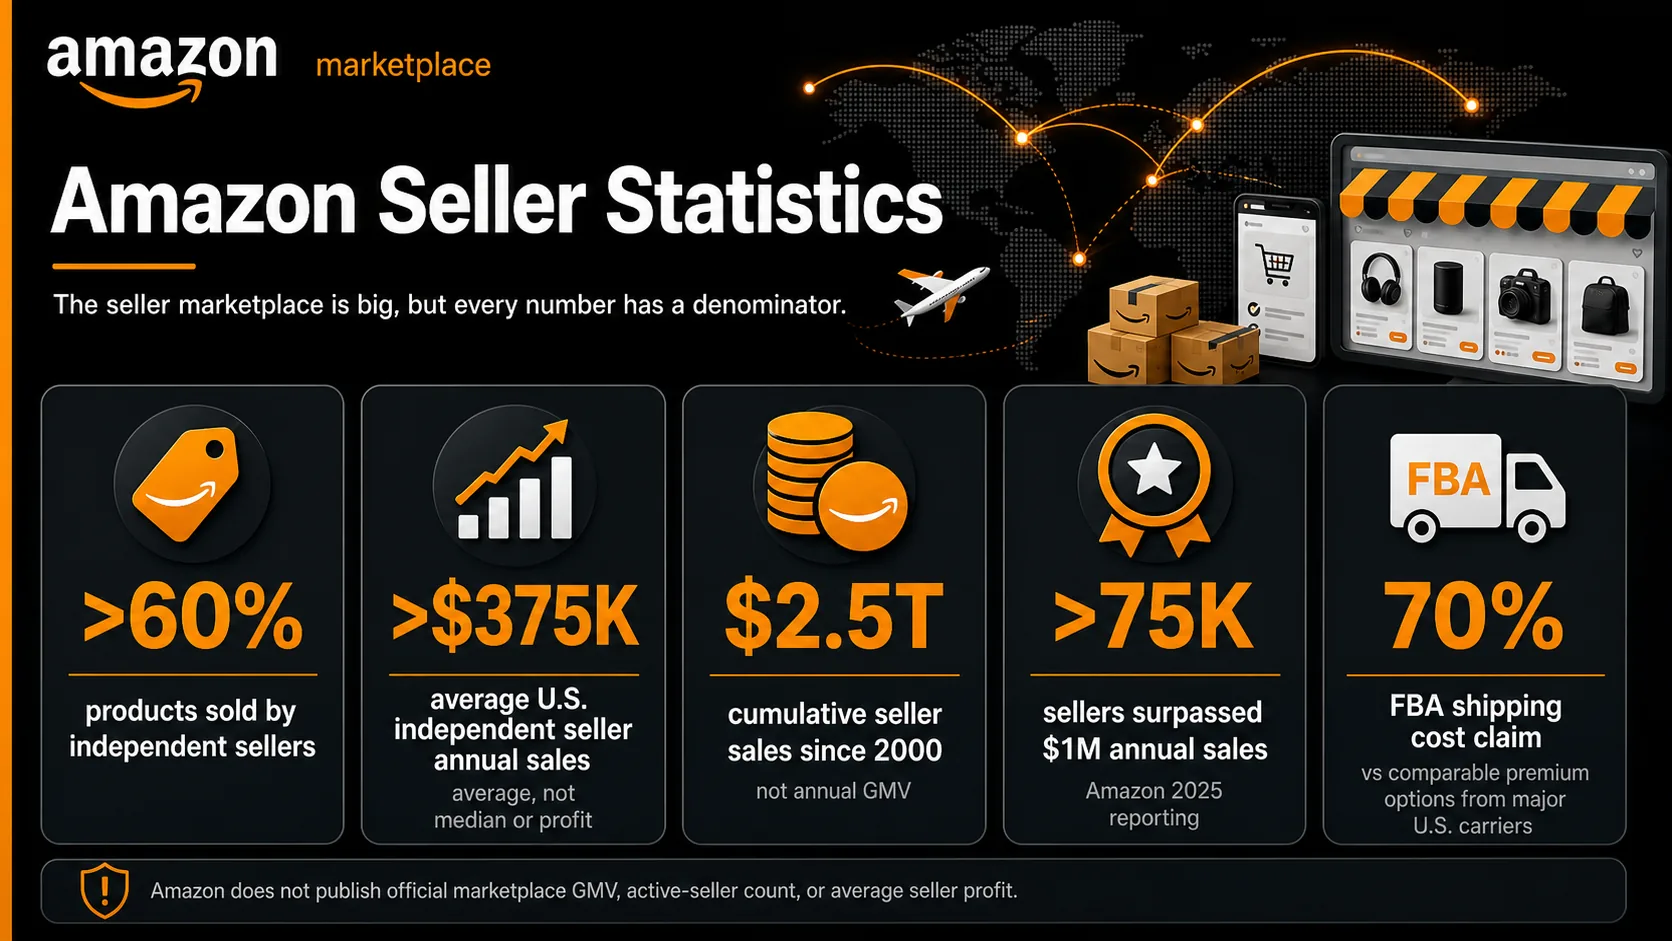
Amazon’s seller ecosystem is large, economically important, and often misunderstood — and the biggest source of confusion is measurement. Amazon reports its own revenue, including “third-party seller services,” but it does not publish a comprehensive marketplace GMV figure, an active-seller count, or average seller profit in its SEC filings.
Seller sales, seller-fee revenue, unit share, advertising revenue, fulfillment costs, and survey-based sentiment all describe different things. This article summarizes the strongest available Amazon seller statistics from the research dossier — Amazon official reports and seller pages, Amazon SEC and investor materials, survey research with visible methodology, and public ecommerce context from the U.S. Census Bureau, BEA, FTC, OECD, UNCTAD, and World Bank — and keeps each number tied to what it actually measures.
Top Statistics
Each headline below is Amazon’s own disclosure unless noted. Read the sections that follow for the caveats: these figures describe seller sales, program claims, and survey sentiment — not a single blended marketplace total.
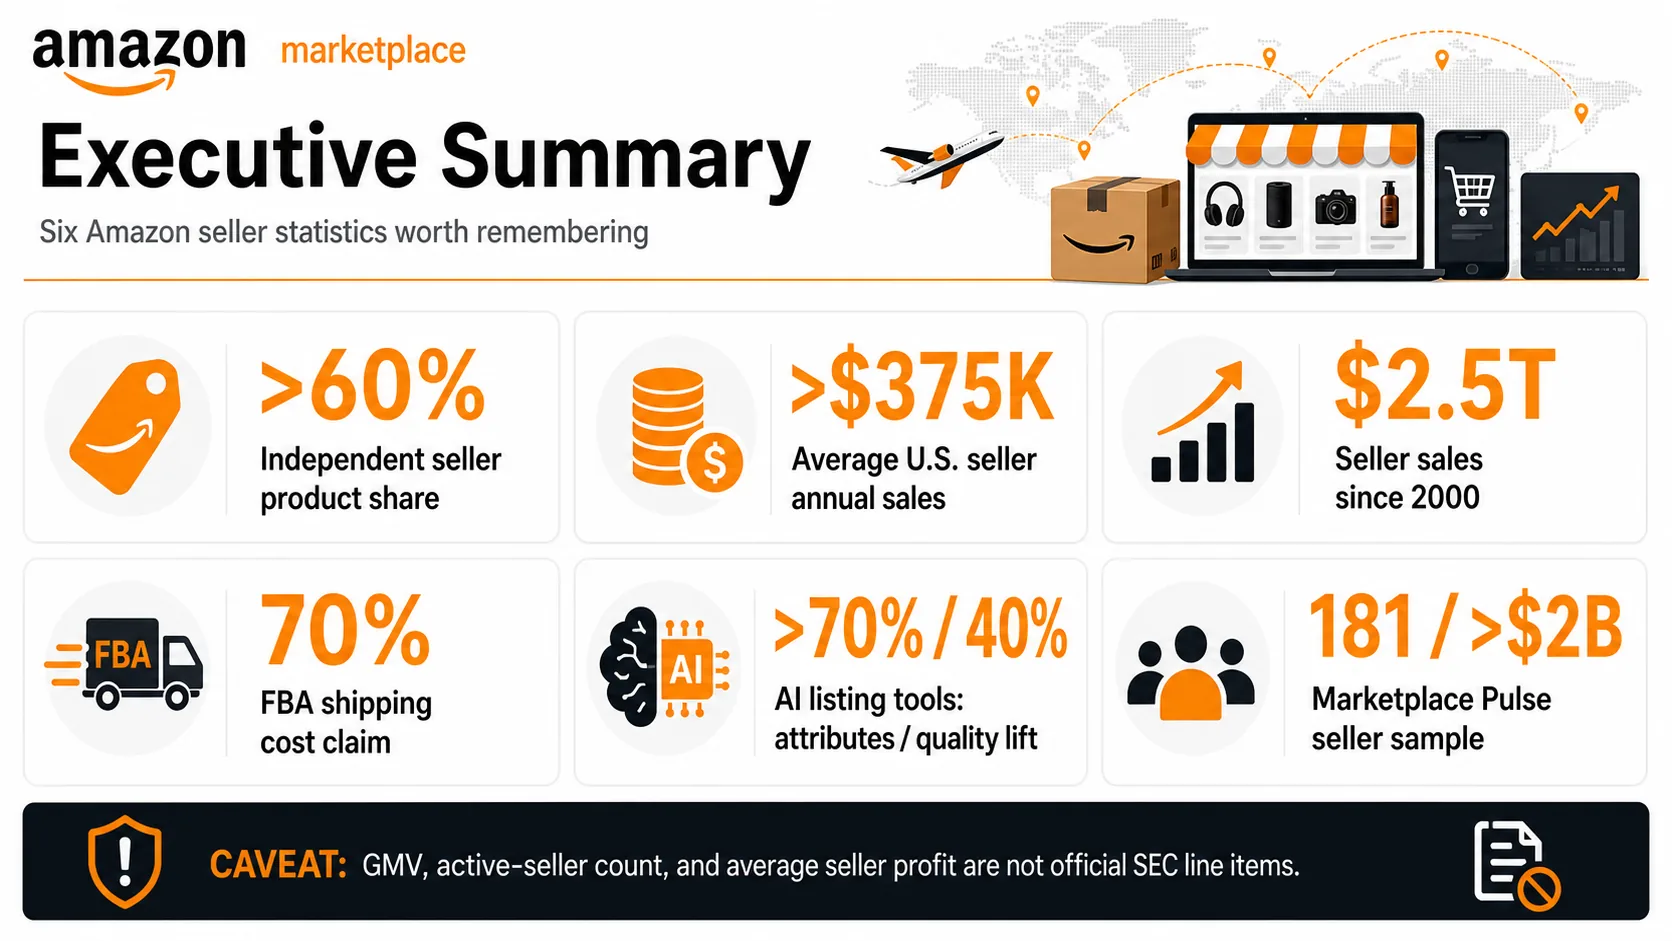
Marketplace scale & seller impact
Logistics & fulfillment claims
AI tools & advertising
Survey evidence (visible methodology)
Definitions and Caveats
The first rule of Amazon seller statistics is to separate seller sales from Amazon revenue. When Amazon says independent sellers account for more than 60% of products sold in its store, that is a unit-share statement about marketplace activity (About Amazon). When Amazon reports “Third-party Seller Services” in its financial statements, it is reporting Amazon’s revenue from seller-related services — not the full sales value captured by merchants (SEC).
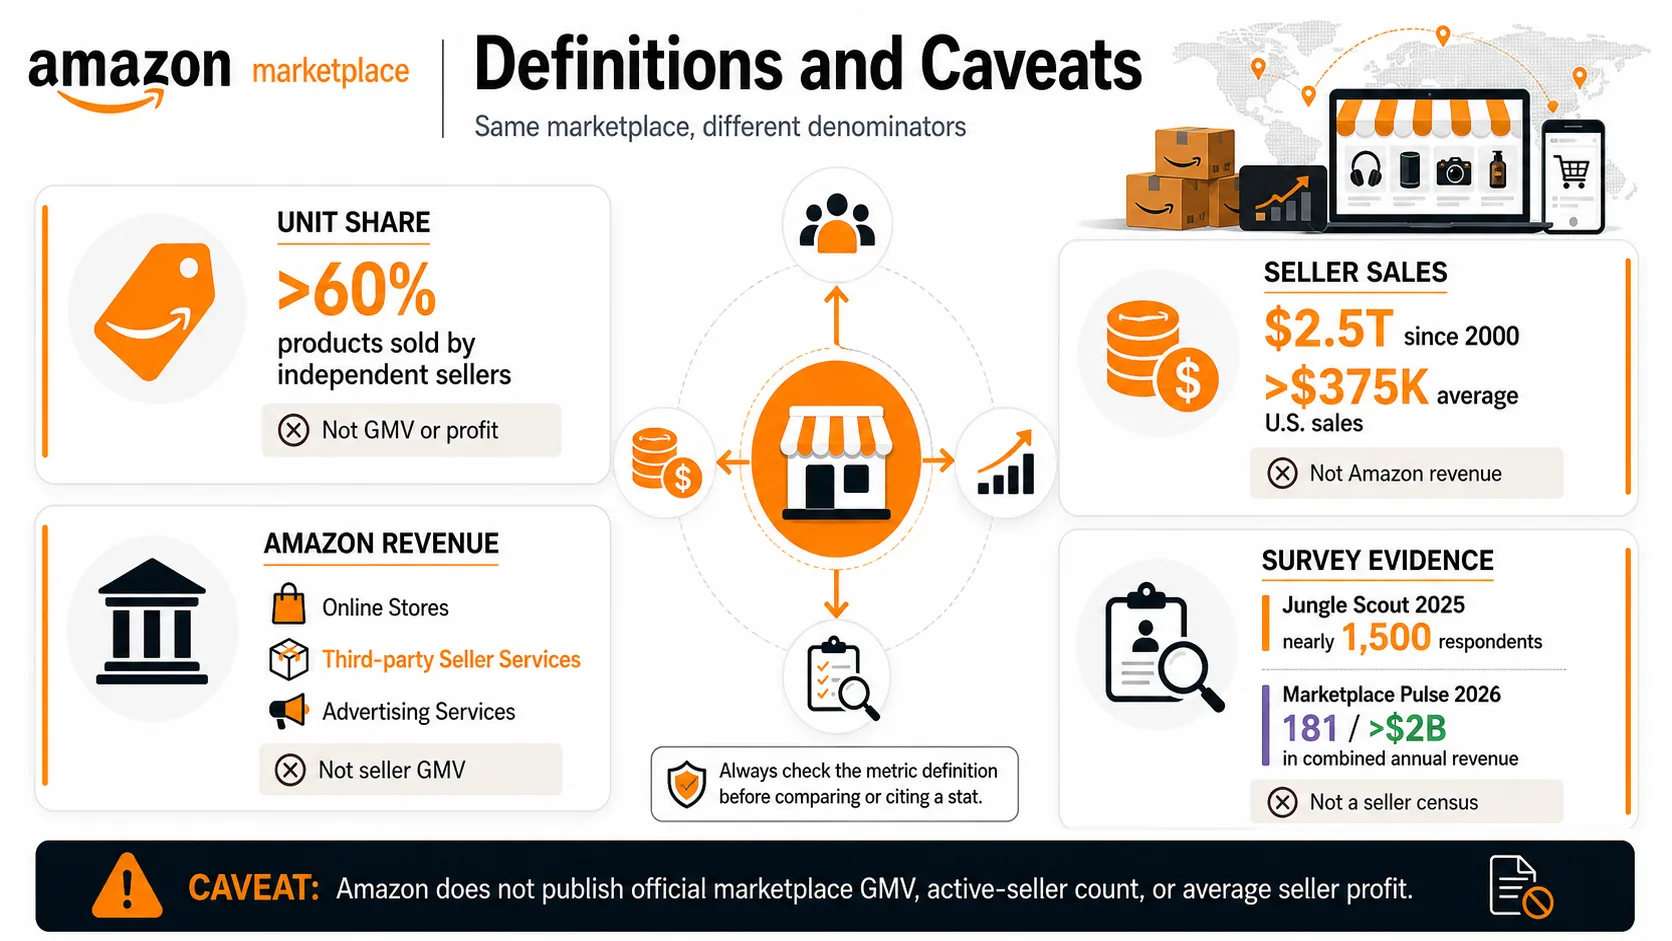
Amazon’s “Online Stores” category is also not the same as total Amazon ecommerce activity: it is Amazon’s first-party retail revenue from products Amazon sells directly, whereas “Third-party Seller Services” includes commissions and related fulfillment and shipping fees from marketplace sellers (SEC). Advertising Services is a separate category tied to sponsored ads, which many sellers use but which should not be confused with seller sales (Amazon IR).
Seller sales
What merchants sell
Unit share and seller-sales figures like the 60%+ product share and $2.5T cumulative total. Marketplace activity — not Amazon revenue, and not profit.
About AmazonAmazon revenue
What Amazon books
SEC categories: Online Stores, Third-party Seller Services, Advertising, Subscription, AWS. Fee revenue from sellers is not seller GMV.
SECProgram claims
What the tools promise
The 70% FBA cost claim, 25% Buy with Prime lift, and 40% listing-quality lift are Amazon internal data points, not audited universal outcomes.
Sell on AmazonSurvey sentiment
What sellers report
Jungle Scout and Marketplace Pulse disclose sample size and timing, but survey findings are self-reported — not an official Amazon census.
Jungle ScoutSeveral common numbers should be handled cautiously. Amazon does not regularly publish an official current count of active sellers, and it does not publish average seller profit, a marketplace-wide profit distribution, or a standard seller GMV line in SEC filings (Amazon IR). A seller may generate revenue on Amazon, pay referral and FBA fees, buy ads, hold inventory, face returns, and still end with a profit or a loss depending on category economics — which is exactly why Amazon’s fee estimator exists (Sell on Amazon).
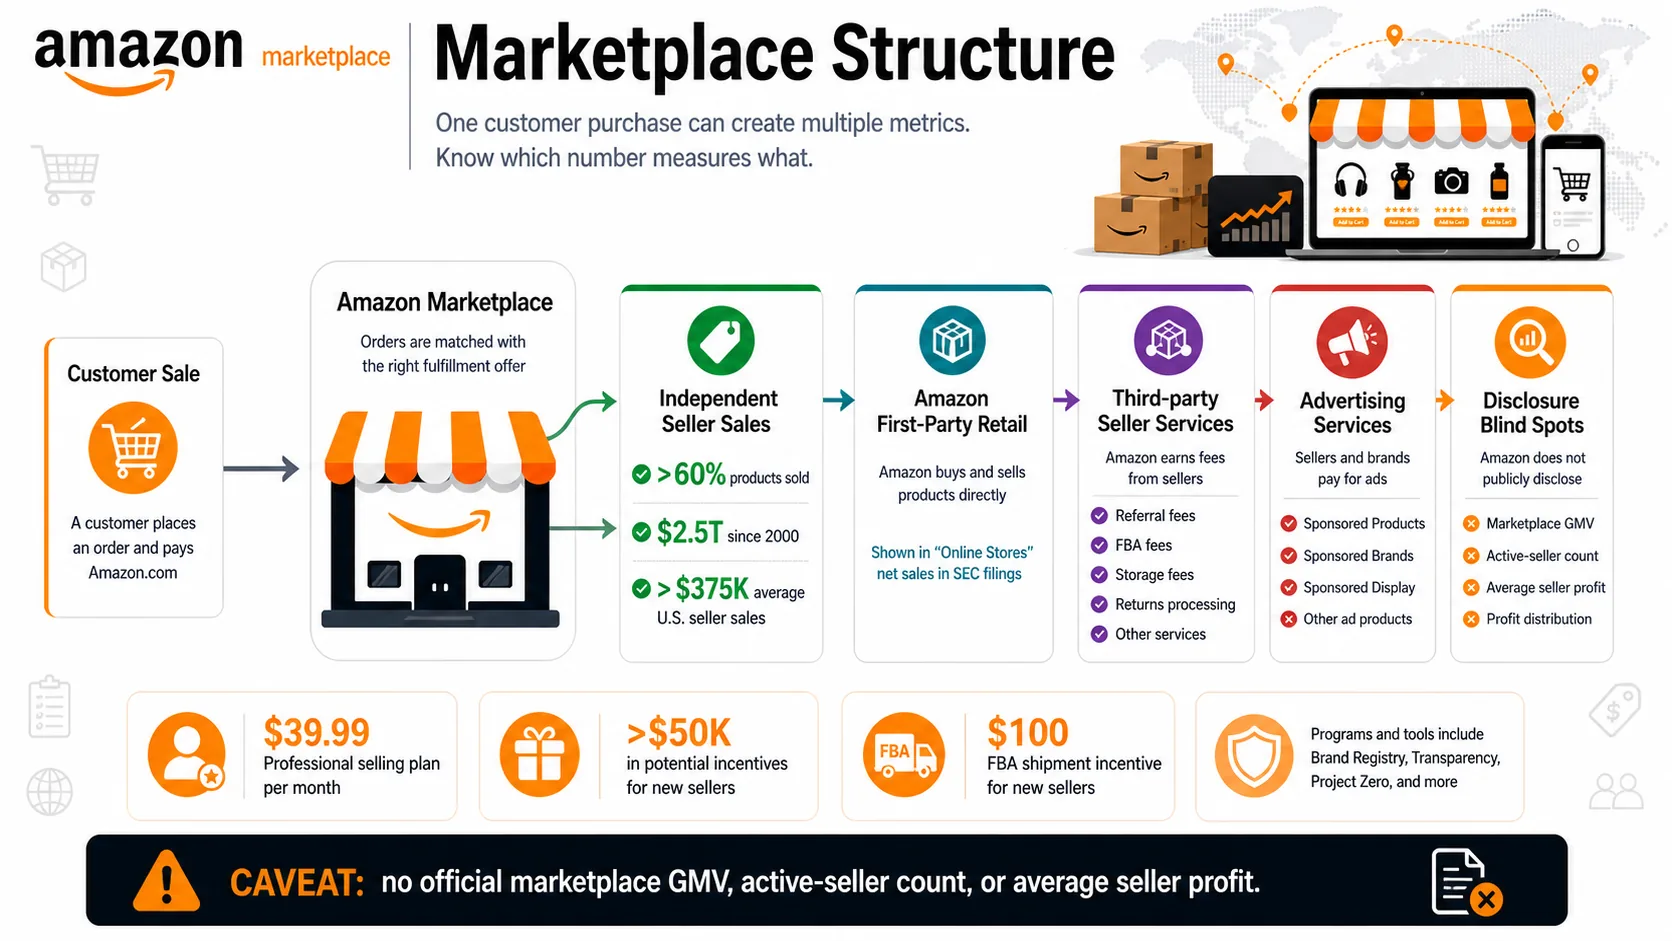
Finally, ecommerce-wide sources usually do not isolate Amazon. The U.S. Census Bureau measures quarterly retail ecommerce across the whole economy, not Amazon seller GMV (U.S. Census Bureau); OECD and UNCTAD provide international measurement frameworks rather than Amazon-specific seller reports.
Marketplace Scale and Seller Impact
Amazon’s own seller-impact materials show that independent sellers are central to the store’s retail mix. The headline figure is that independent sellers account for more than 60% of products sold in Amazon’s store (About Amazon).
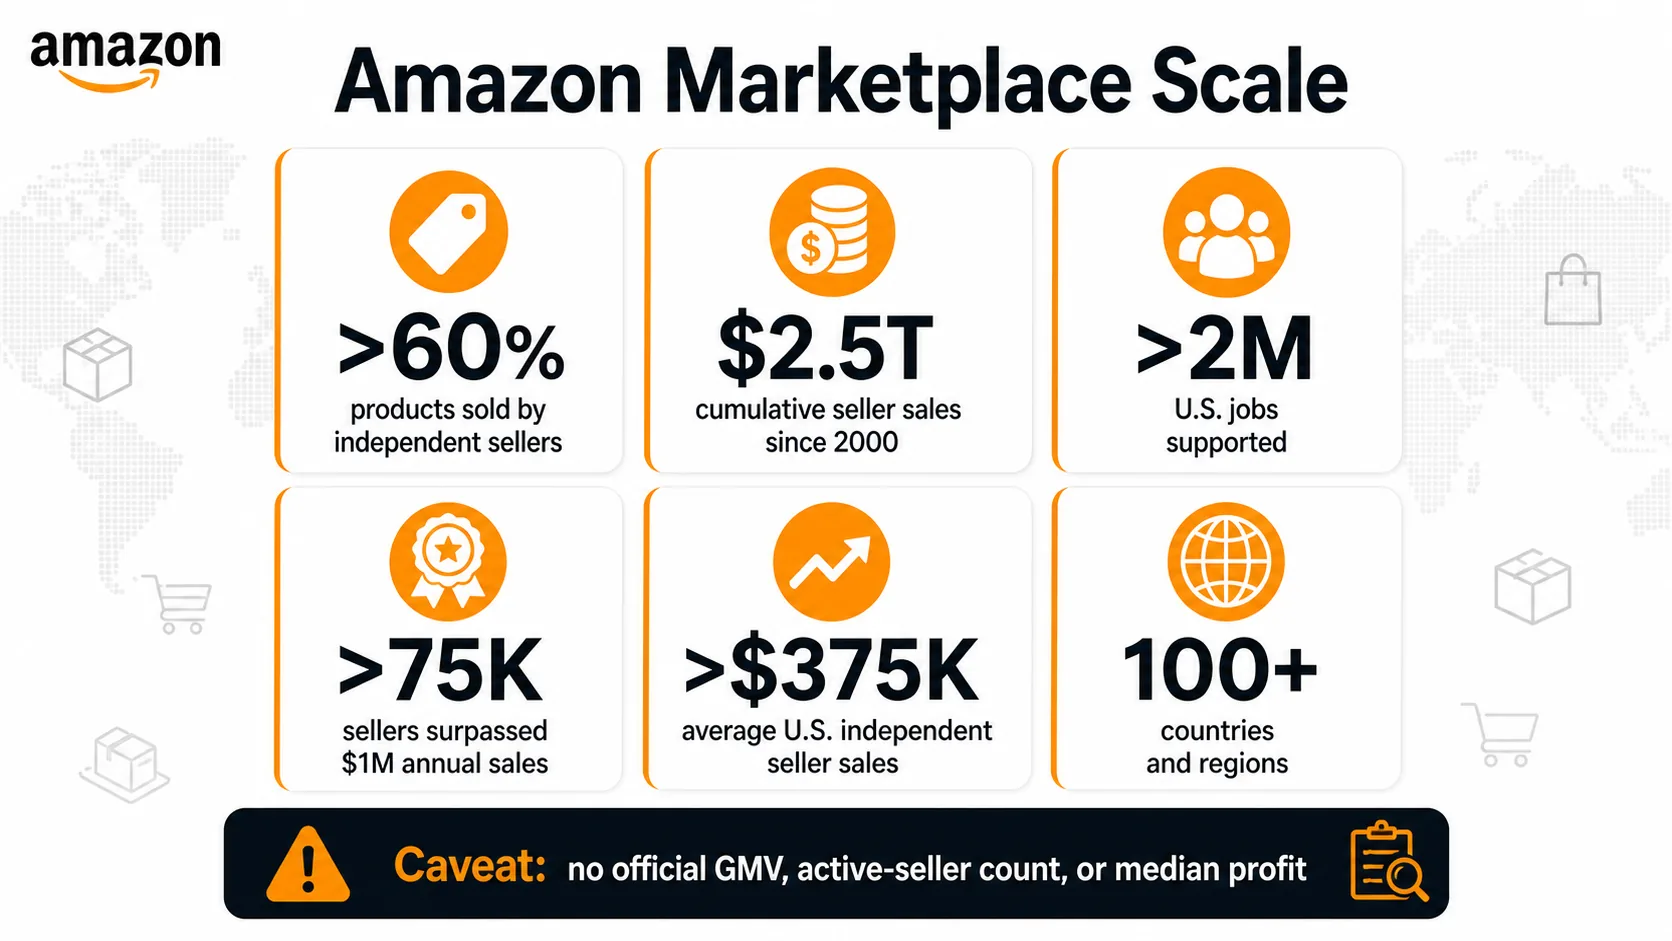
The 2025 Small Business Empowerment Report is the core official source for recent seller-impact figures; the full PDF consolidates sales share, million-dollar sellers, units sold, export impact, jobs, financing, and AI adoption (Amazon PDF). One of the most important long-run statistics is Amazon’s statement that independent sellers have generated $2.5 trillion in cumulative seller sales since 2000 (About Amazon).
The scale of higher-revenue sellers is also notable: Amazon says more than 75,000 independent sellers surpassed $1 million in annual sales, and that U.S. independent sellers averaged more than $375,000 in annual sales (About Amazon). That average should be read carefully — averages are lifted by very large sellers and do not describe the median seller, the typical new seller, or profitability.
Seller Economics, Fees, and Amazon Financial Reporting
Amazon seller economics can be viewed from two angles: the seller’s income statement and Amazon’s income statement. The seller’s includes product revenue, cost of goods, Amazon fees, fulfillment, storage, returns, advertising, software, labor, and taxes. Amazon’s records revenue categories such as Online Stores, Third-party Seller Services, Advertising Services, Subscription Services, and AWS (Amazon IR).
The most seller-relevant Amazon line is “Third-party Seller Services.” In SEC reporting, this represents Amazon’s fee revenue from marketplace sellers — commissions and related fulfillment and shipping fees. It is not seller GMV, not seller revenue, and not seller profit (SEC). A seller can make $100 in customer sales while Amazon recognizes only its applicable fee revenue from that transaction.
One transaction, two ledgers
That same $100 customer sale reaches Amazon’s books only as its applicable fees — which is why “Third-party Seller Services” revenue is not seller GMV, seller revenue, or seller profit.
The same $100 customer sale means different things on the seller's income statement and on Amazon's. Tap to switch.
Amazon IR / SECThe seller cost stack begins with the selling plan: the Professional plan costs $39.99 per month plus selling fees, and Amazon’s pricing page details referral fees, FBA fees, storage fees, optional advertising, and other costs (Sell on Amazon). This is why “average seller profit” claims are weak unless clearly survey-based and methodologically disclosed — Amazon does not publish a marketplace-wide average seller profit figure.
The regulatory environment also matters. The FTC has sued Amazon, alleging practices that affect marketplace sellers, fulfillment, pricing, and competition (FTC). Those allegations remain disputed and unresolved, so they should be described as allegations, not findings.
Fulfillment, Logistics, and Prime-Related Seller Statistics
Fulfillment is a major part of Amazon seller economics because it affects conversion, fees, customer experience, returns, and operational complexity. Amazon’s Fulfillment by Amazon page states that FBA shipping costs are 70% lower per unit than comparable premium options offered by other major U.S. carriers — an Amazon internal comparison, best treated as a cost-benchmark claim rather than a guaranteed outcome (Sell on Amazon).
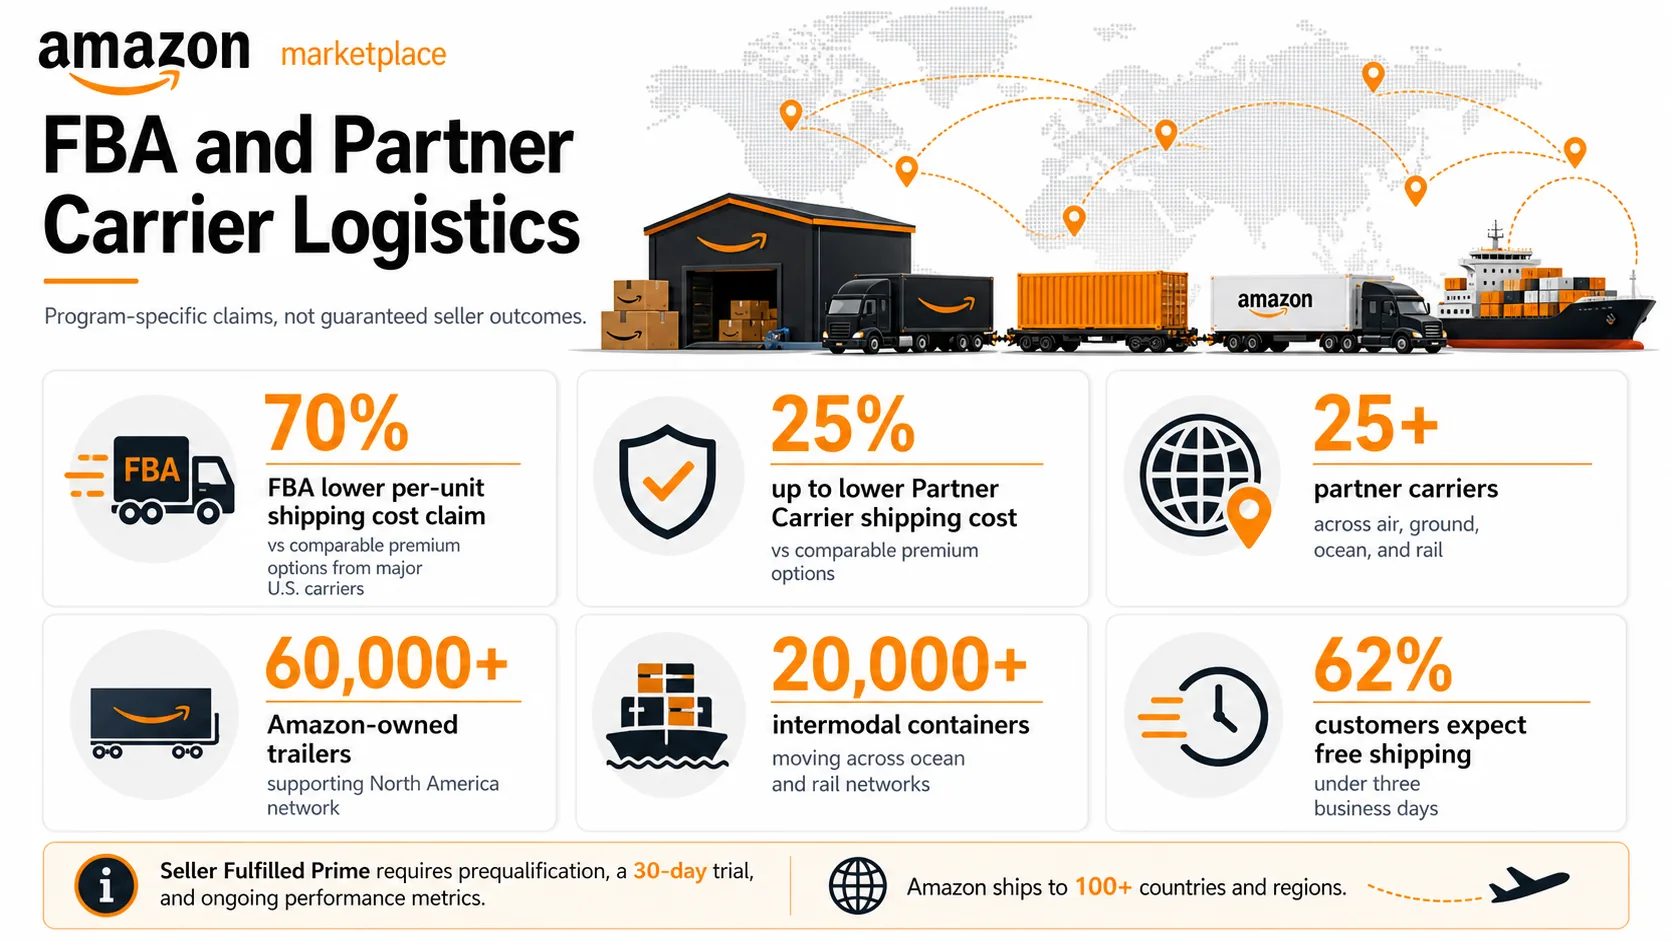
The Partner Carrier Program adds another layer: Amazon says shipping through the program can be up to 25% lower than alternatives, and that it uses 25+ partner carriers, 60,000+ Amazon-owned trailers, and 20,000+ intermodal containers (Sell on Amazon). The phrase “up to” matters — it is a potential maximum, not a universal savings rate.
Seller Fulfilled Prime differs from FBA because the seller handles fulfillment while meeting Prime delivery standards; its page notes that sellers must prequalify, complete a 30-day trial, and continuously meet performance metrics, and cites that 62% of customers expect free shipping in under three business days (Sell on Amazon). Buy with Prime extends Amazon-linked fulfillment beyond Amazon’s store; Amazon says it increases off-Amazon purchase likelihood by 25% on average (Sell on Amazon).
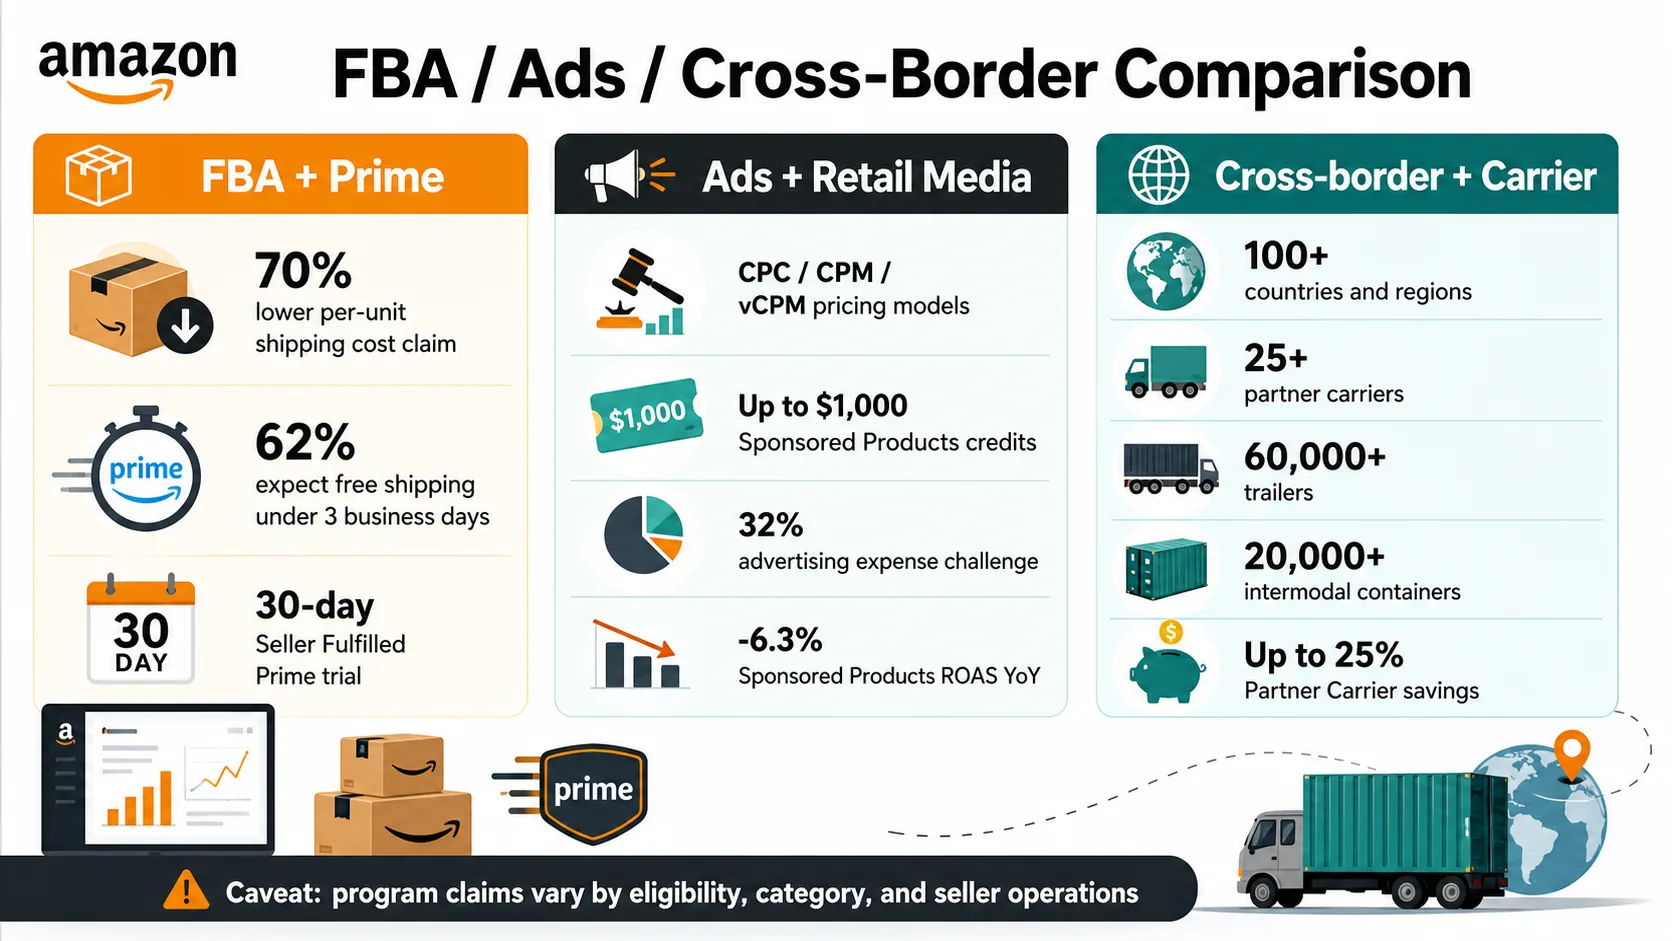
The main caveat: public sources do not provide a definitive official share of Amazon marketplace sales fulfilled by FBA. Claims such as “FBA accounts for exactly X% of marketplace sales” should be treated as estimates unless sourced to transparent methodology.
Advertising and Retail Media Statistics for Sellers
Advertising is a major part of the modern Amazon seller toolkit, but it should not be confused with an official requirement — Amazon’s pricing page lists Amazon Ads as optional and separate from core selling fees (Sell on Amazon). Amazon Ads explains that Sponsored Products use cost-per-click pricing, and that Amazon Ads uses CPC, CPM, and vCPM models depending on campaign type — so there is no single universal CPC for sellers (Amazon Ads).
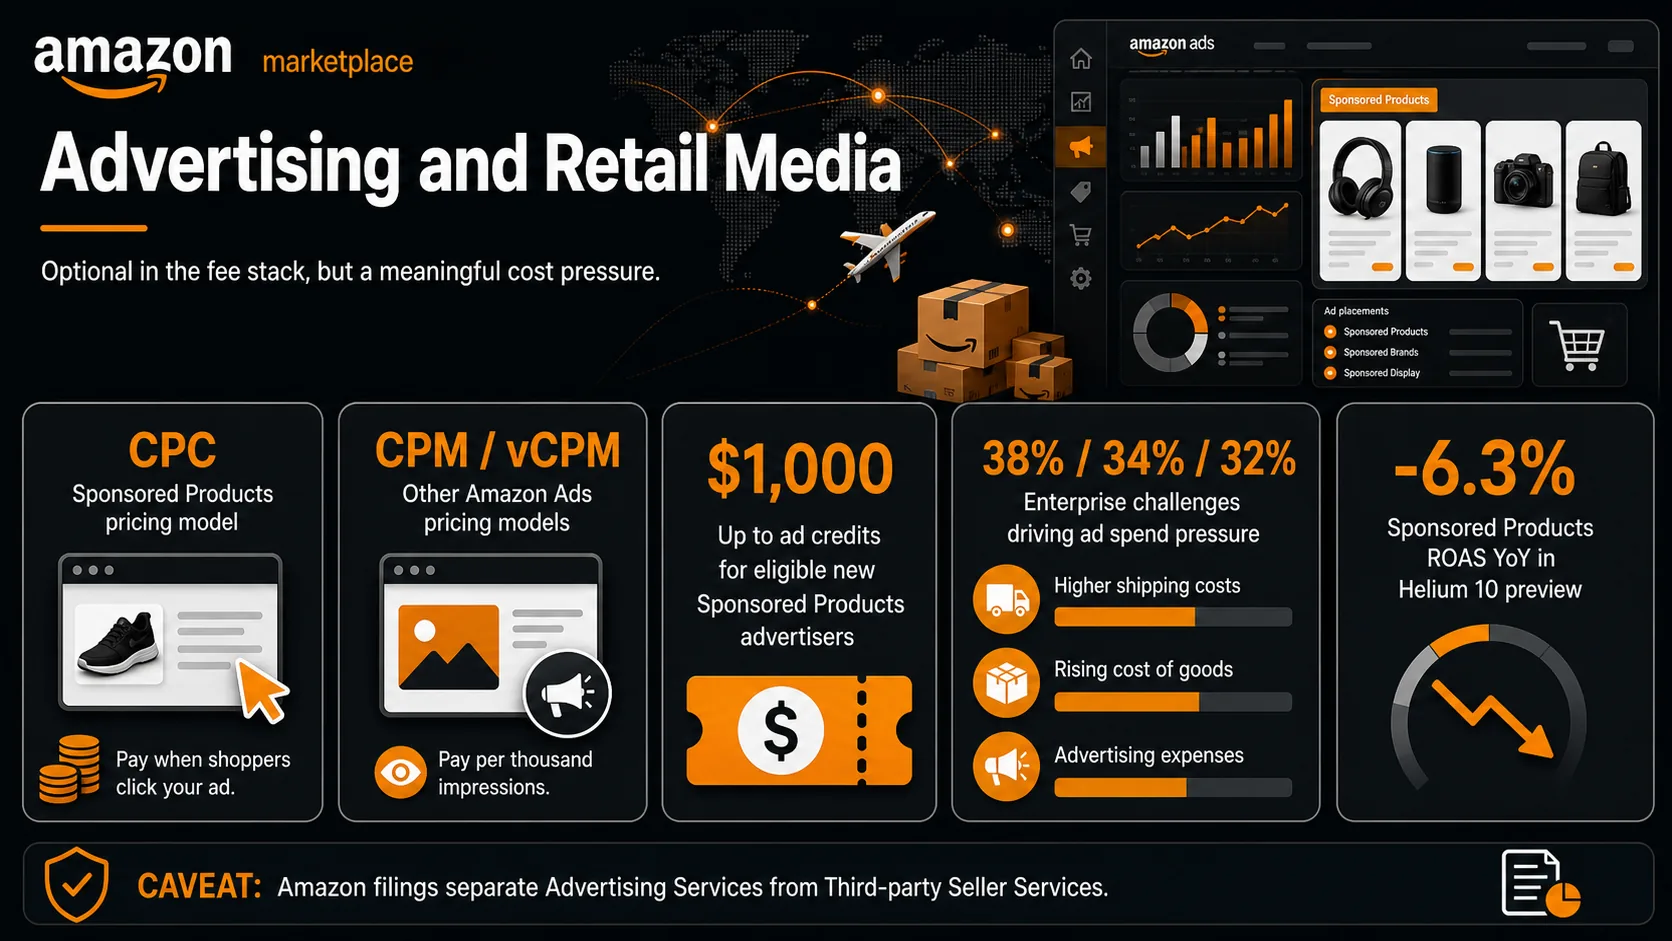
Seller survey data reinforces that advertising costs are a concern, especially for larger brands. Among enterprise brands in Jungle Scout’s 2025 survey, 32% cited advertising expenses as a top challenge — alongside 38% citing higher shipping costs and 34% citing rising cost of goods (Jungle Scout).
Helium 10’s Q2 2025 retail-media benchmark preview adds category-level context: it says two-thirds of Amazon product categories experienced double-digit year-over-year ad-spend growth, and that Sponsored Products ROAS was down 6.3% year over year (Helium 10). Because this is a benchmark preview rather than a disclosed seller survey, it is best used as advertising-market context, not a statement about all seller profitability.
Seller Tools, AI, Onboarding, and Automation
Amazon’s seller tooling has expanded well beyond basic listing creation. Seller Central now includes an AI-powered Seller Assistant, and Amazon’s Selling Partners hub highlights A+ Content, Product Opportunity Explorer, Brand Analytics, and other AI-supported tools (Selling Partners). The strongest public AI statistics come from Amazon’s AI listing tools: Amazon says they generate more than 70% of required product attributes, and that sellers using them see a 40% increase in overall listing quality (Sell on Amazon).
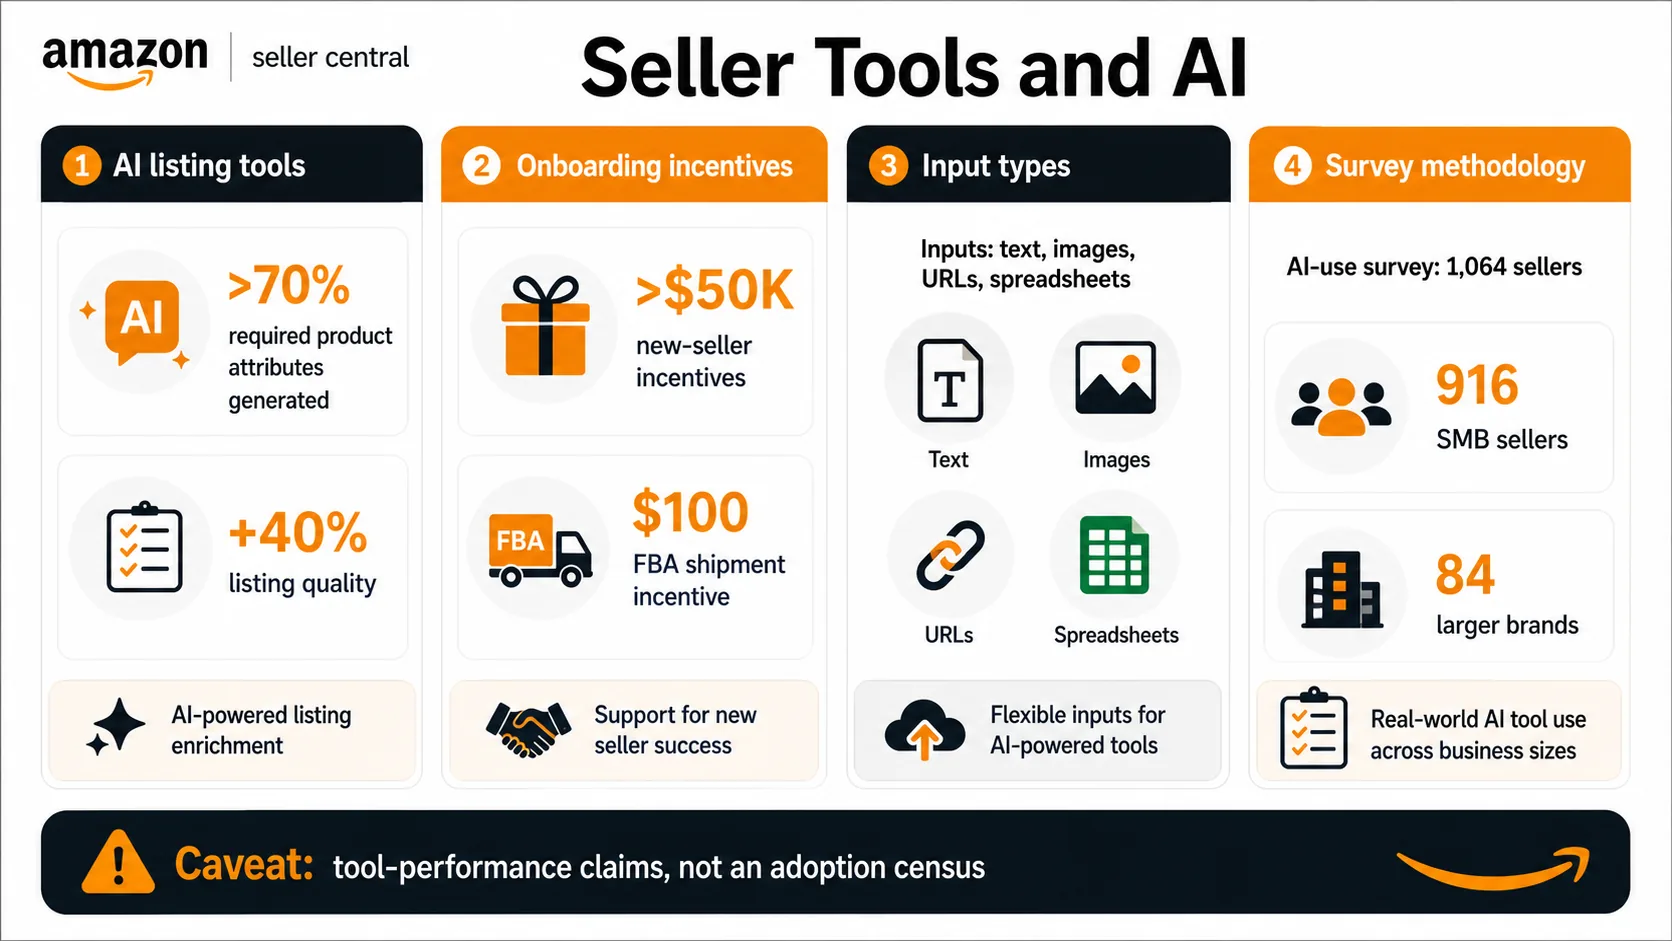
These are Amazon internal data points — useful for understanding claimed tool performance, but not generalizable to every seller or category, and sellers remain responsible for reviewing AI-generated content for accuracy and compliance. On onboarding economics, Amazon says new sellers can access more than $50,000 in incentives through Seller Central (Sell on Amazon) — best read as program- and eligibility-based incentives, not guaranteed value. AI adoption is also being measured outside Amazon: eMarketer’s methodology note for a Jungle Scout 2024 AI-use chart states the survey included 1,064 first- and third-party Amazon sellers (916 SMB, 84 enterprise brands) (eMarketer).
Survey Evidence on Sellers, Brands, and Marketplace Health
Survey research is useful because official Amazon sources rarely describe seller sentiment, competitive stress, or profit outcomes. The best survey sources are those with visible methodology, sample size, respondent profile, and survey timing. Jungle Scout’s 2025 State of the Amazon Seller report surveyed nearly 1,500 Amazon sellers and businesses between Jan 10 and Jan 27, 2025, across more than 20 countries (Jungle Scout).
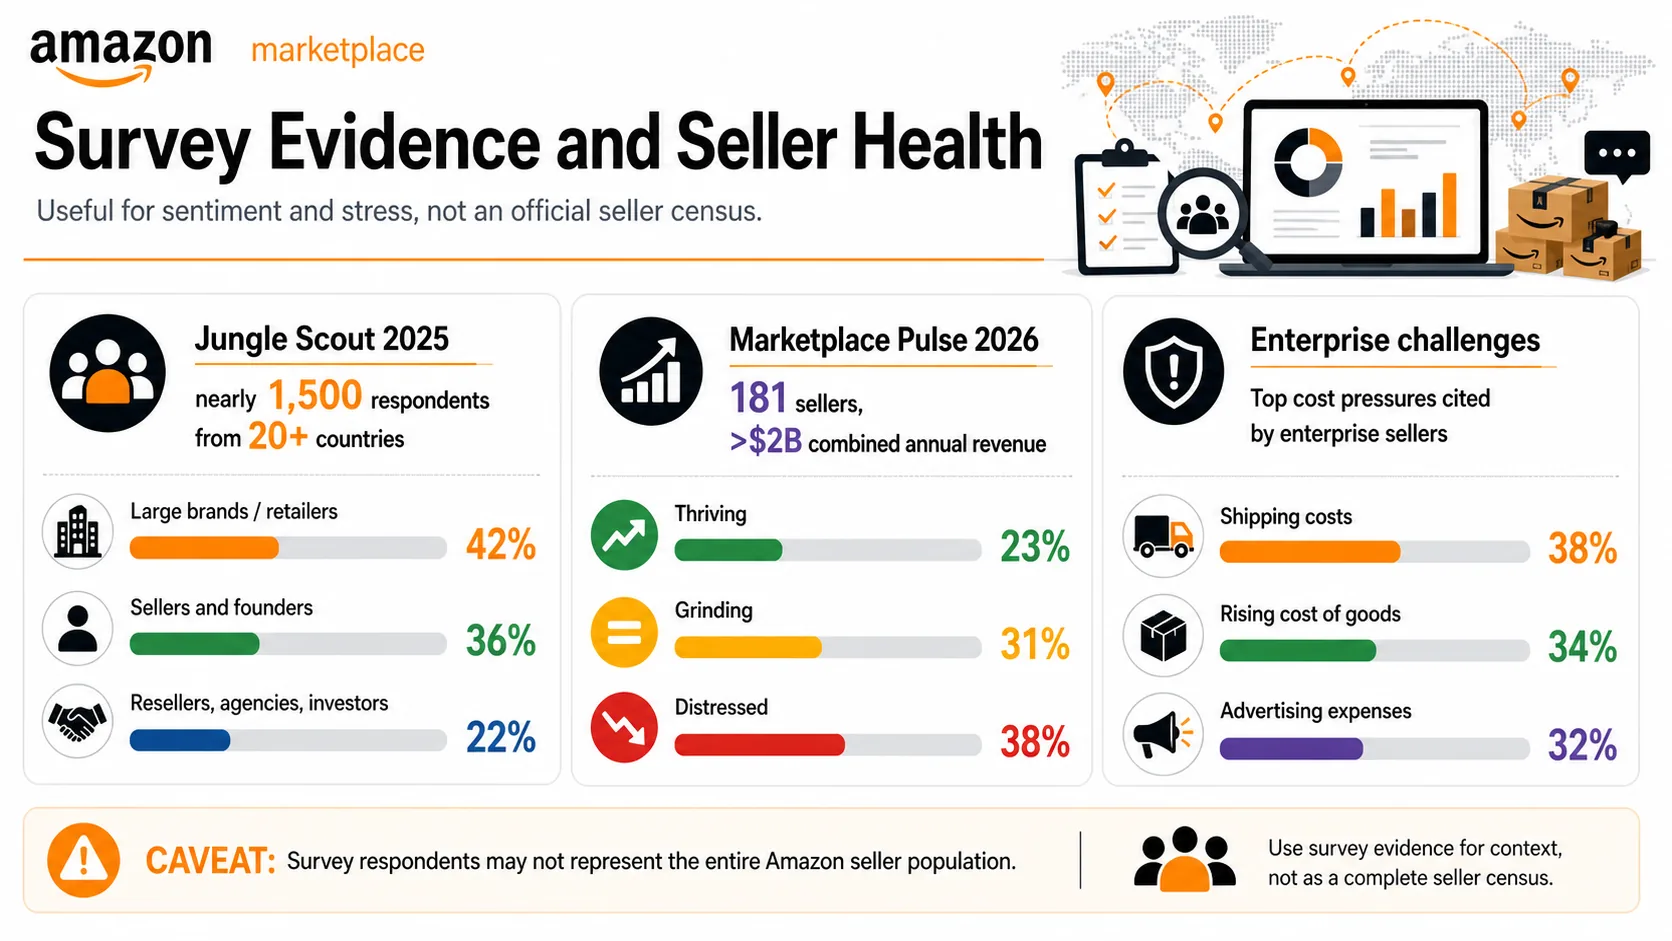
Marketplace Pulse provides a different kind of seller survey: a health index. Its Seller Index 2026 surveyed 181 marketplace sellers representing more than $2 billion in combined annual revenue, classifying 23% as thriving, 31% as grinding, and 38% as distressed (Marketplace Pulse).
The major caveat with all seller surveys is selection bias. Respondents may be more engaged, more software-aware, more brand-oriented, or more stressed than the overall seller population. Surveys reveal perceived challenges and self-reported behavior — they are not a complete Amazon seller census.
Risks, Competition, Brand Protection, and Regulatory Context
Amazon selling involves marketplace opportunity and marketplace risk. The official cost structure alone shows several risk categories — referral fees, fulfillment fees, storage costs, returns processing, and optional advertising can all affect margins (Sell on Amazon). Competition is another: many sellers compete within shared product detail pages and category search results, facing pricing pressure, Buy Box competition, and ad-auction pressure.
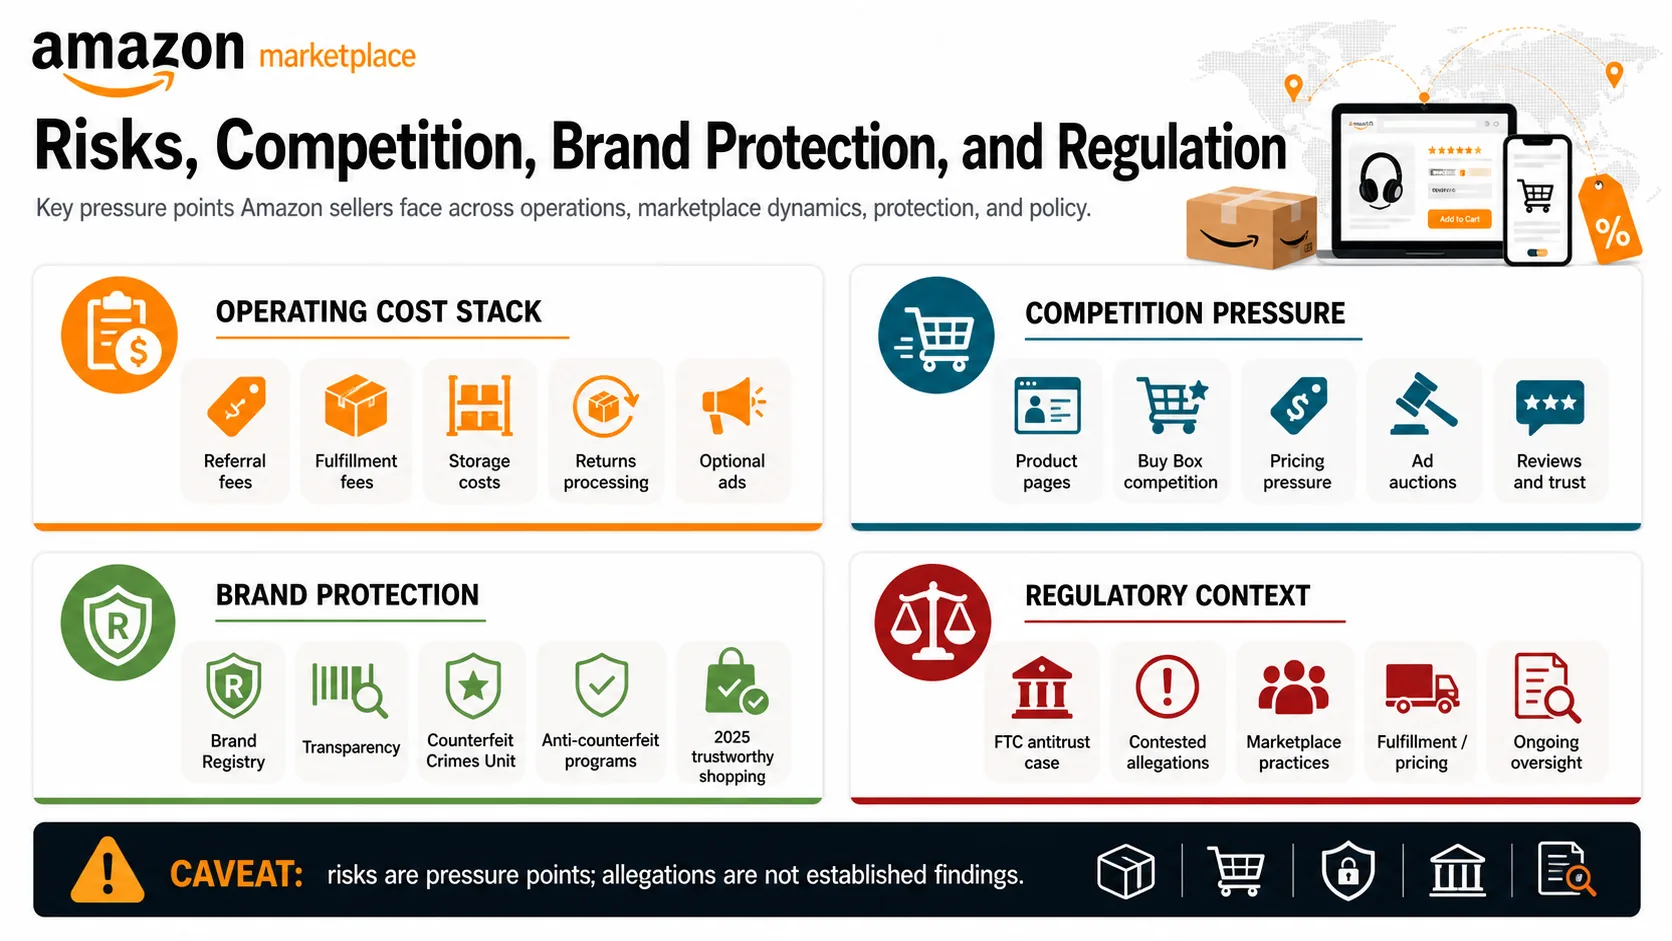
Brand protection and counterfeit risk are also relevant, especially for brands and authorized resellers. Amazon’s counterfeits policy page describes Brand Registry, Transparency, the Counterfeit Crimes Unit, and anti-counterfeit programs (About Amazon), and its 2023 Brand Protection Report documents enforcement and IP initiatives (Amazon Assets). These programs are evidence that Amazon invests in enforcement — and also that counterfeit and IP issues remain ongoing marketplace risks. Macroeconomic context matters too: the BEA tracks the digital economy beyond retail ecommerce (BEA), and the BLS Consumer Price Index helps distinguish nominal from inflation-adjusted growth (BLS).
Source Quality Note
The strongest Amazon seller statistics come from Amazon official sources and Amazon filings — but those sources have their own limitations.
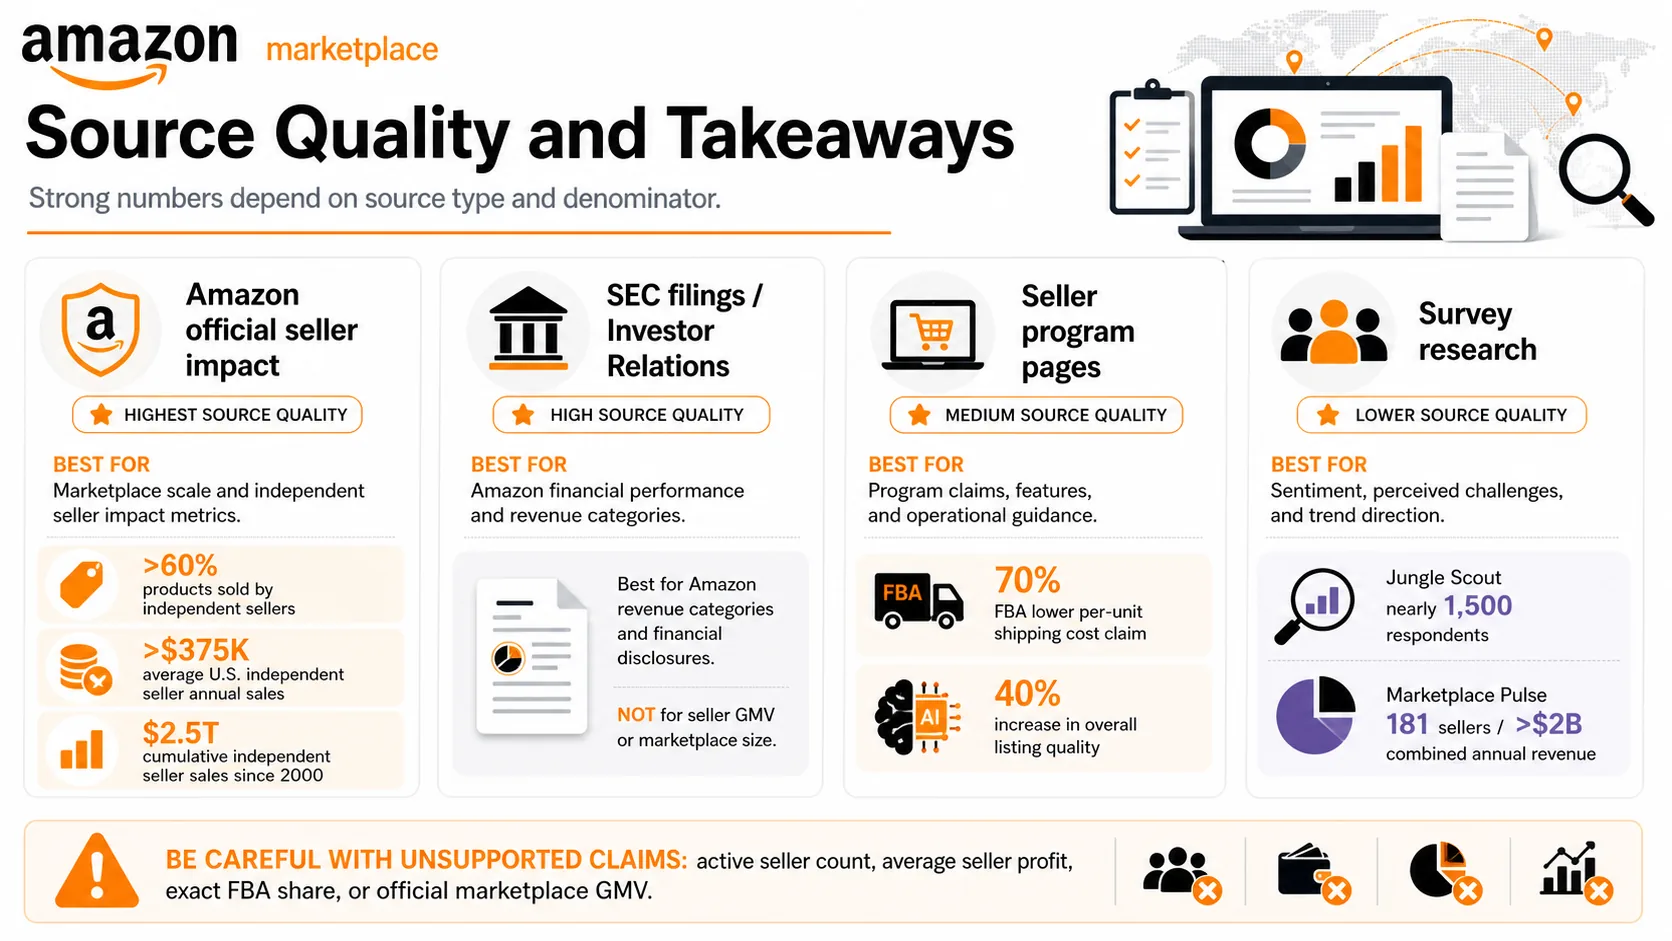
Amazon impact reports — authoritative for disclosed seller stats.
The 60%+ share, $375K+ average U.S. sales, 75K+ million-dollar sellers, and $2.5T cumulative sales come from Amazon’s seller-impact reporting.
SEC filings — authoritative for revenue, silent on the marketplace.
They define Amazon revenue categories and risk disclosures but do not disclose marketplace GMV, active-seller count, or average seller profit.
Program pages — authoritative for claims, often without public method.
The 70% FBA cost claim, 25% Buy with Prime lift, and 40% listing-quality lift are Amazon internal data points.
Surveys — valuable when methodology is visible.
Jungle Scout and Marketplace Pulse publish sample size and timing, but findings should be described as survey findings, not marketplace facts.
Government / international — high-quality context, not Amazon-specific.
Census, BEA, OECD, and UNCTAD benchmark ecommerce and the digital economy but do not isolate Amazon sellers.
Frequently Asked Questions
What share of products on Amazon are sold by independent sellers?
More than 60%, according to Amazon’s 2025 Small Business Empowerment Report. It is a unit- or product-share statement about marketplace activity, not a share of Amazon’s revenue and not a GMV figure.
How much does the average Amazon seller make?
Amazon says U.S. independent sellers averaged more than $375,000 in annual sales in 2025. That is average sales, not profit — averages are lifted by very large sellers, and Amazon does not publish a marketplace-wide average seller profit figure.
Does Amazon report its marketplace GMV?
No. In SEC filings Amazon reports revenue categories such as Online Stores, Third-party Seller Services, Advertising Services, Subscription Services, and AWS, but it does not disclose a marketplace GMV, an active-seller count, or average seller profit as standard line items.
How much does it cost to sell on Amazon?
The Professional selling plan costs $39.99 per month plus selling fees. Total cost also depends on referral fees, FBA and storage fees, returns, and optional advertising, which is why Amazon provides a fee estimator that varies by product and fulfillment method.
How many Amazon sellers make over $1 million a year?
More than 75,000 independent sellers surpassed $1 million in annual sales, according to Amazon’s 2025 seller reporting. Amazon also says independent sellers have generated $2.5 trillion in cumulative sales since 2000.
Is Amazon advertising required to sell successfully?
No. Amazon Ads is optional and separate from core selling fees in Amazon’s official pricing. However, survey evidence from Jungle Scout’s 2025 report shows 32% of enterprise brands cite advertising expenses as a top challenge, so it is a meaningful cost for many sellers.
How much cheaper is Fulfillment by Amazon shipping?
Amazon states FBA shipping costs are 70% less per unit than comparable premium options from other major U.S. carriers. This is an Amazon internal comparison and should be read as a cost-benchmark claim, not a guaranteed outcome for every seller.
Sources and Further Reading
Amazon official seller impact & small business reporting
Investor relations, filings & financial definitions
Seller tools, fulfillment, logistics, ads & onboarding
Survey & marketplace research (visible methodology)
Ecommerce, digital economy & regulatory context
Brand protection & intellectual property