Gemini Statistics
Last updated on July 5, 2026

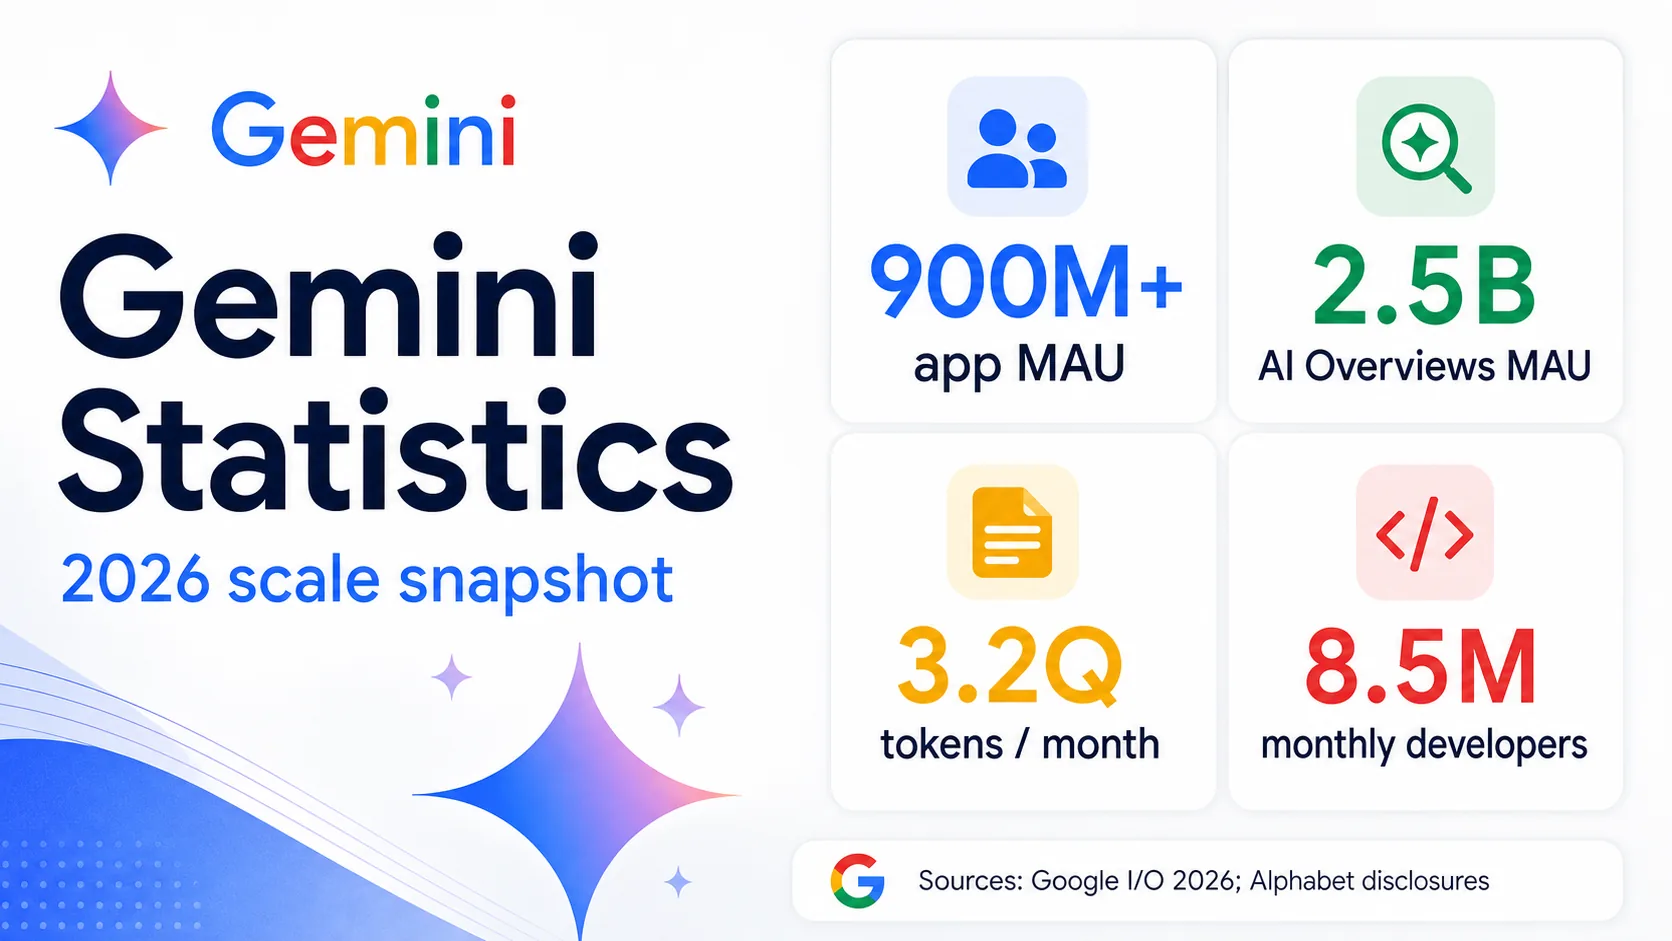
Gemini statistics are easy to misread because “Gemini” is not one product. The name covers a standalone consumer app, a family of models, developer APIs, Vertex AI integrations, Search features such as AI Overviews and AI Mode, Workspace capabilities, Android and Pixel experiences, and NotebookLM.
A single number can therefore mean very different things — monthly active users in the Gemini app, people exposed to AI answers in Google Search, tokens processed across Google’s systems, or developers using Gemini models through APIs. This article separates those layers using only the research dossier. The most important caveat: Google and Alphabet disclose several high-level operating metrics, but they do not disclose standalone Gemini revenue, paid Gemini subscribers, retention, DAU/MAU, global market share, or country-level usage distribution in the cited primary materials.
Top Statistics
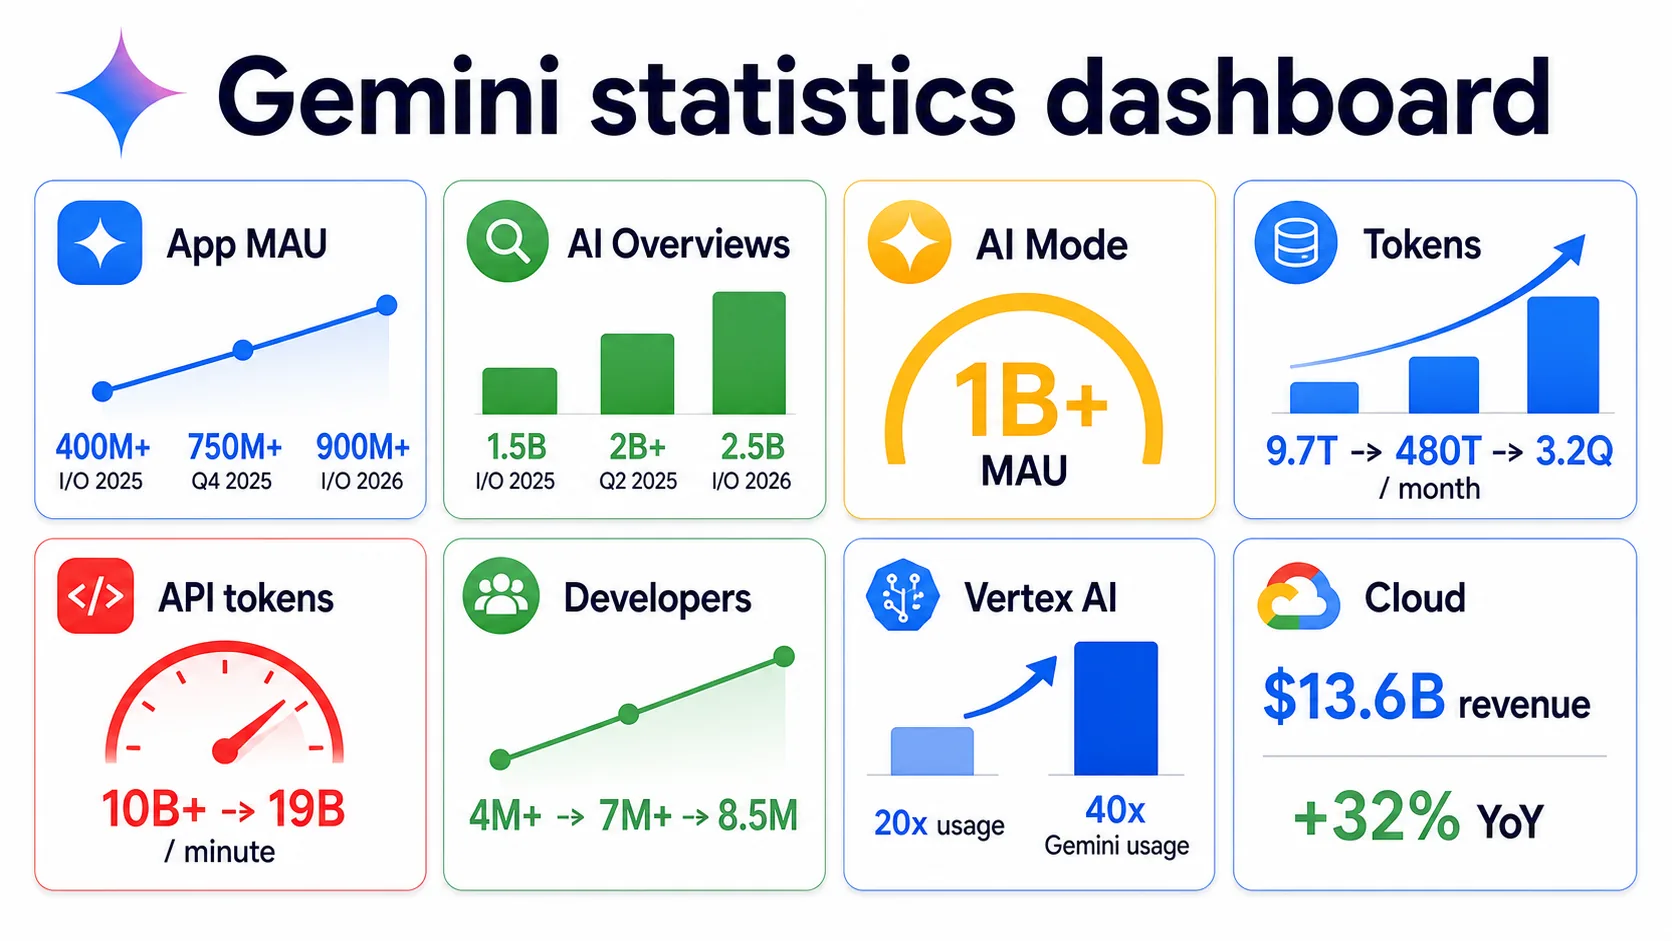
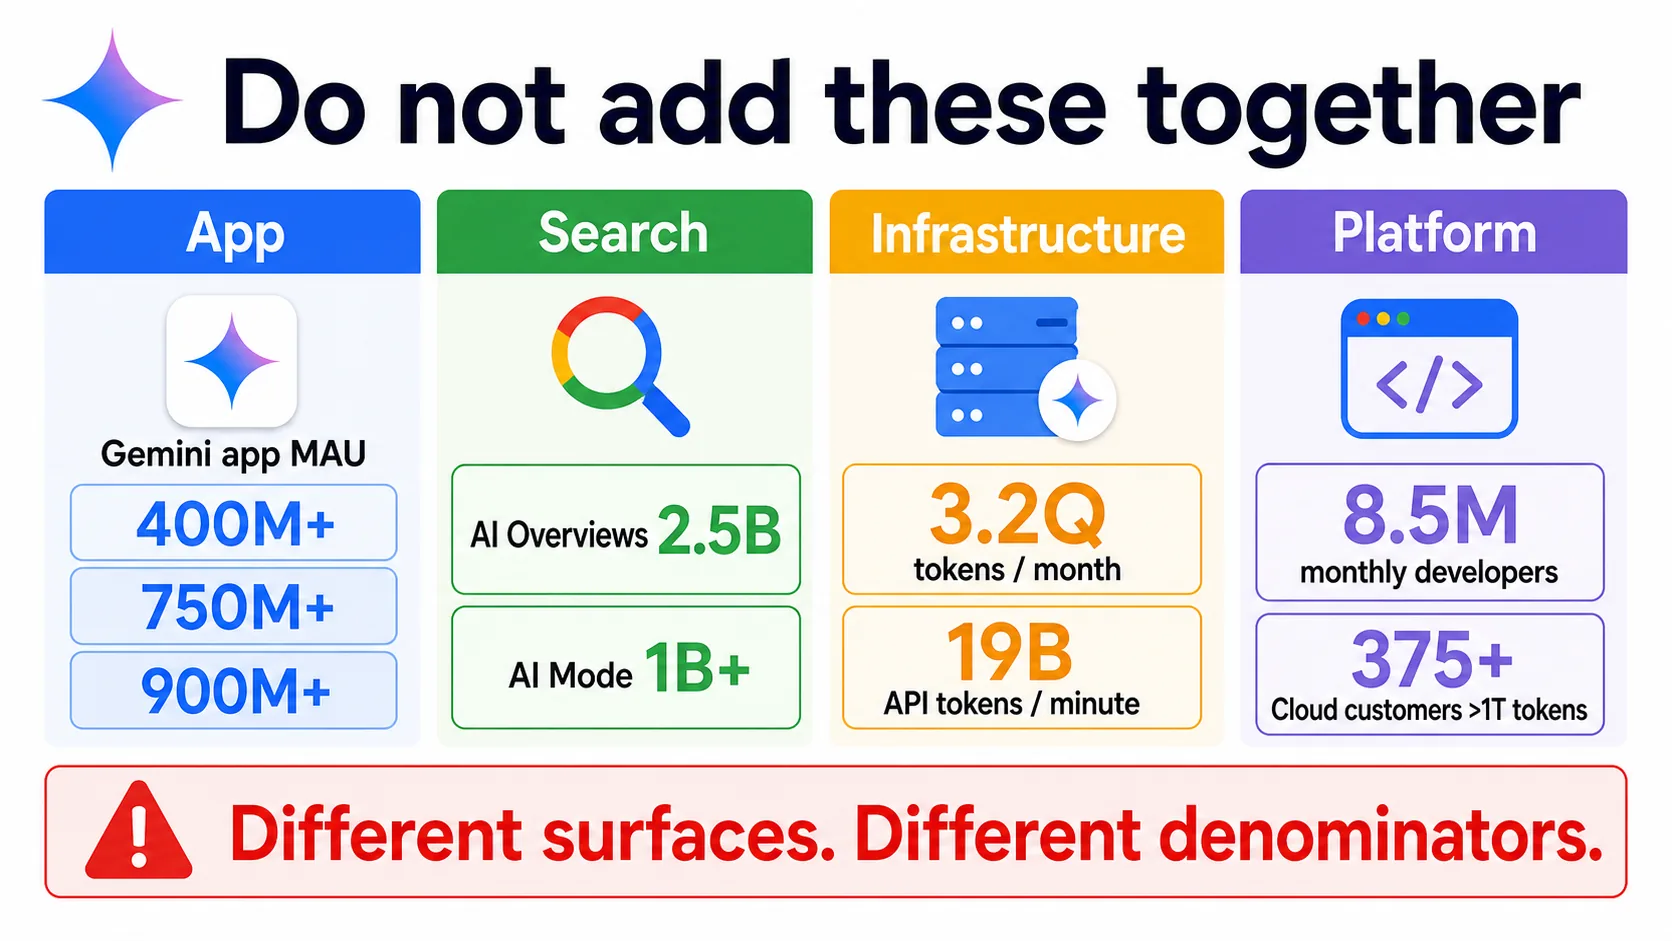
Each figure below is an official Google or Alphabet disclosure. They describe different measurement layers — app users, Search users, infrastructure tokens, and developers — and should not be added together.
Search & infrastructure scale
Cloud & financial context (Alphabet)
Gemini 2.5 benchmarks
Metric Map and Definitions
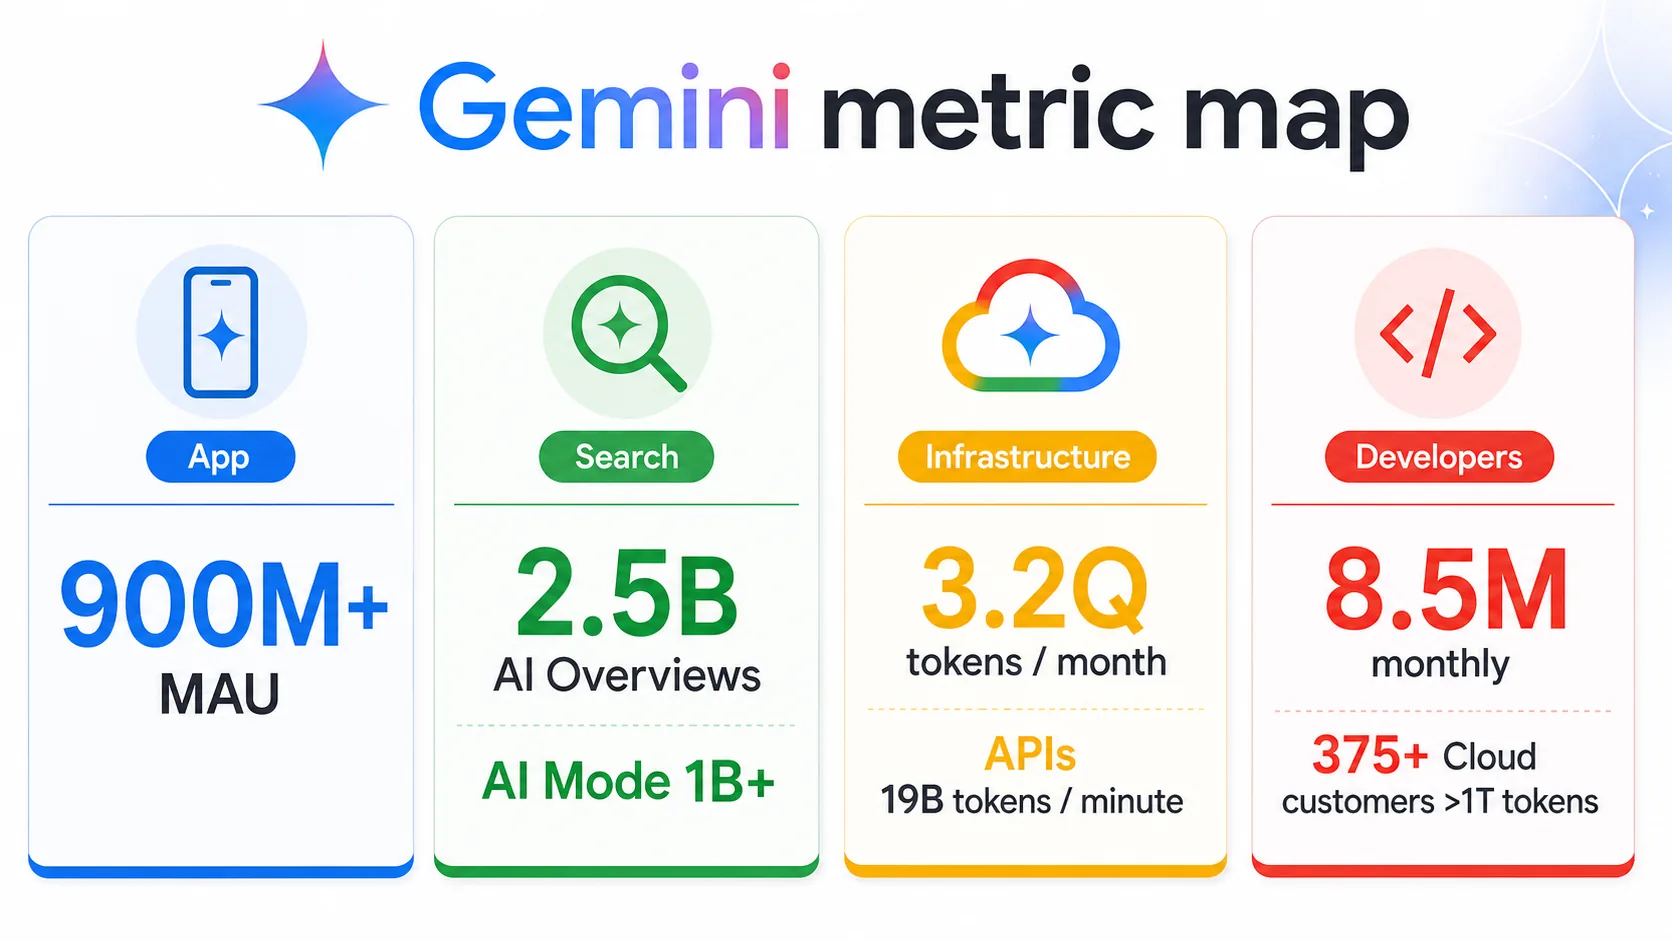
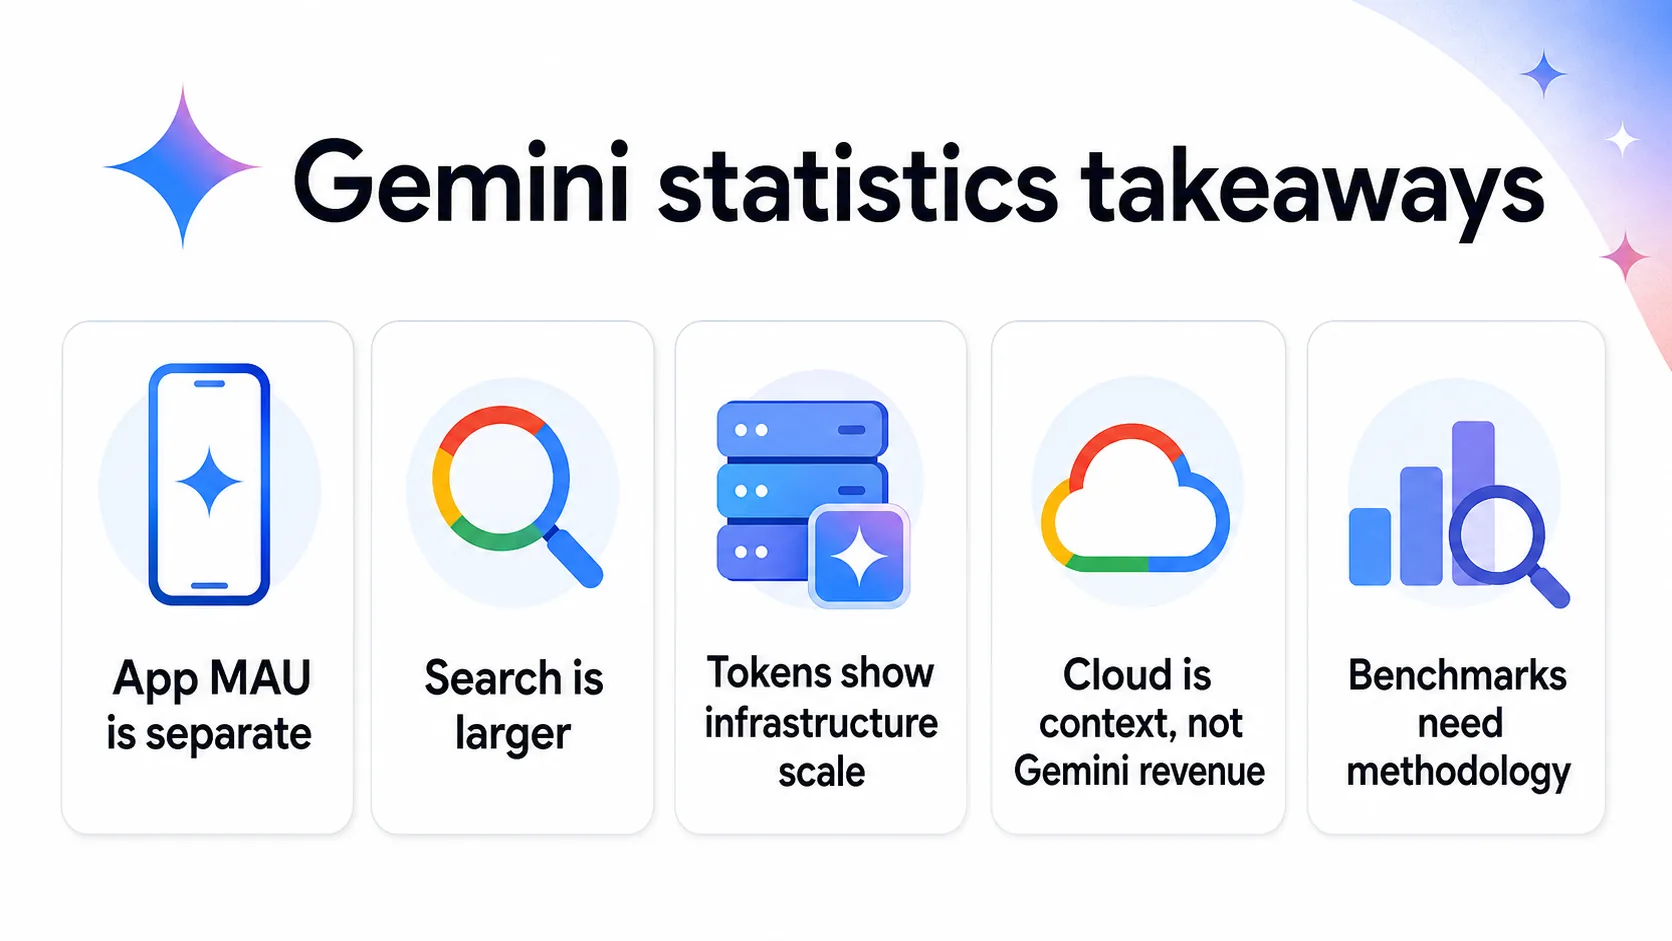
The cleanest way to analyze Gemini statistics is to keep four measurement layers separate: consumer app usage, Search usage, infrastructure token volume, and developer or enterprise platform usage.
Consumer app
Gemini app MAU
The standalone assistant. 400M → 750M → 900M+ monthly active users are app metrics, not Search metrics.
Google I/O 2026Search
AI Overviews & AI Mode
AI-generated summaries and a conversational Search interface. Usage happens in Search — not the standalone app.
Search updatesInfrastructure
Token volume
Tokens per month and per minute across products and APIs — operational scale, not a count of users, sessions, or revenue.
Google I/O 2026Developer / enterprise
Developers & Vertex AI
Developer counts, API throughput, and Cloud customer token processing — ecosystem metrics, not deployed apps or paying end users.
Google Cloud Next 2025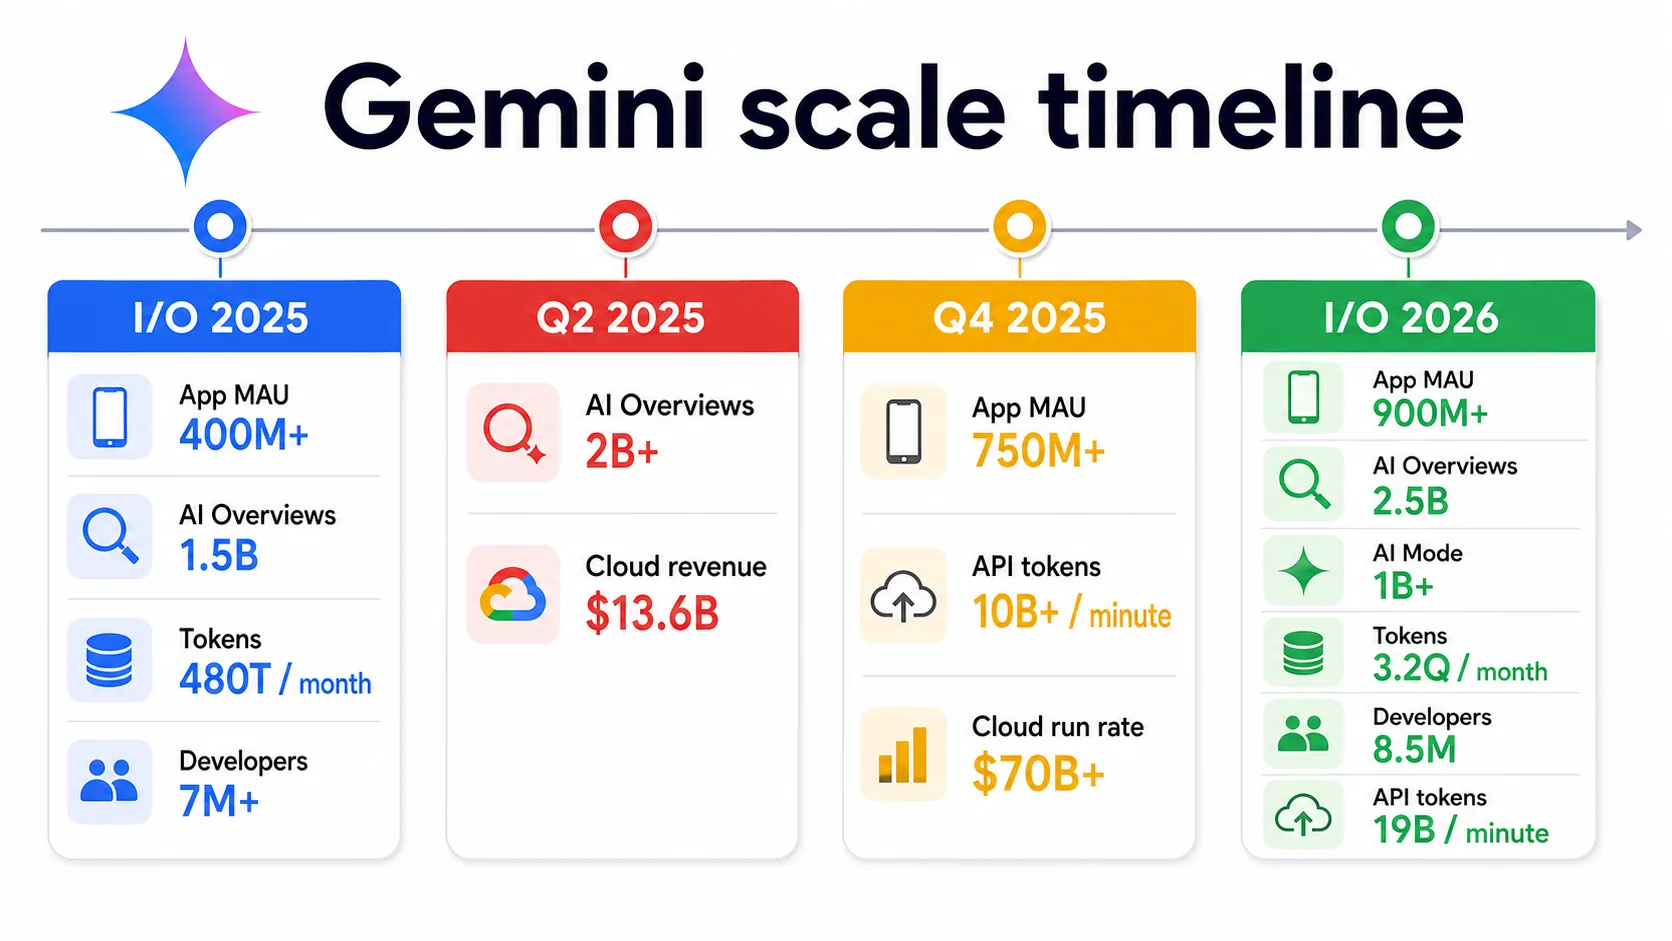
Adding Gemini app MAU, AI Overviews users, and AI Mode users together risks double-counting people who use multiple Google surfaces — a person might use the app, see AI Overviews, and try AI Mode in the same month. The source base does not provide a deduplicated cross-product user total.
Gemini App Adoption
The central consumer adoption statistic is monthly active users for the Gemini app. Google said the app had over 400 million MAU at I/O 2025 (Google I/O 2025), over 750 million in Q4 2025 (Alphabet Q4 2025), and surpassed 900 million by I/O 2026 (Google I/O 2026).
Gemini app monthly active users
Source: Google I/O and Alphabet earnings. Disclosed app MAU — strong evidence of scale, weaker evidence for engagement depth.
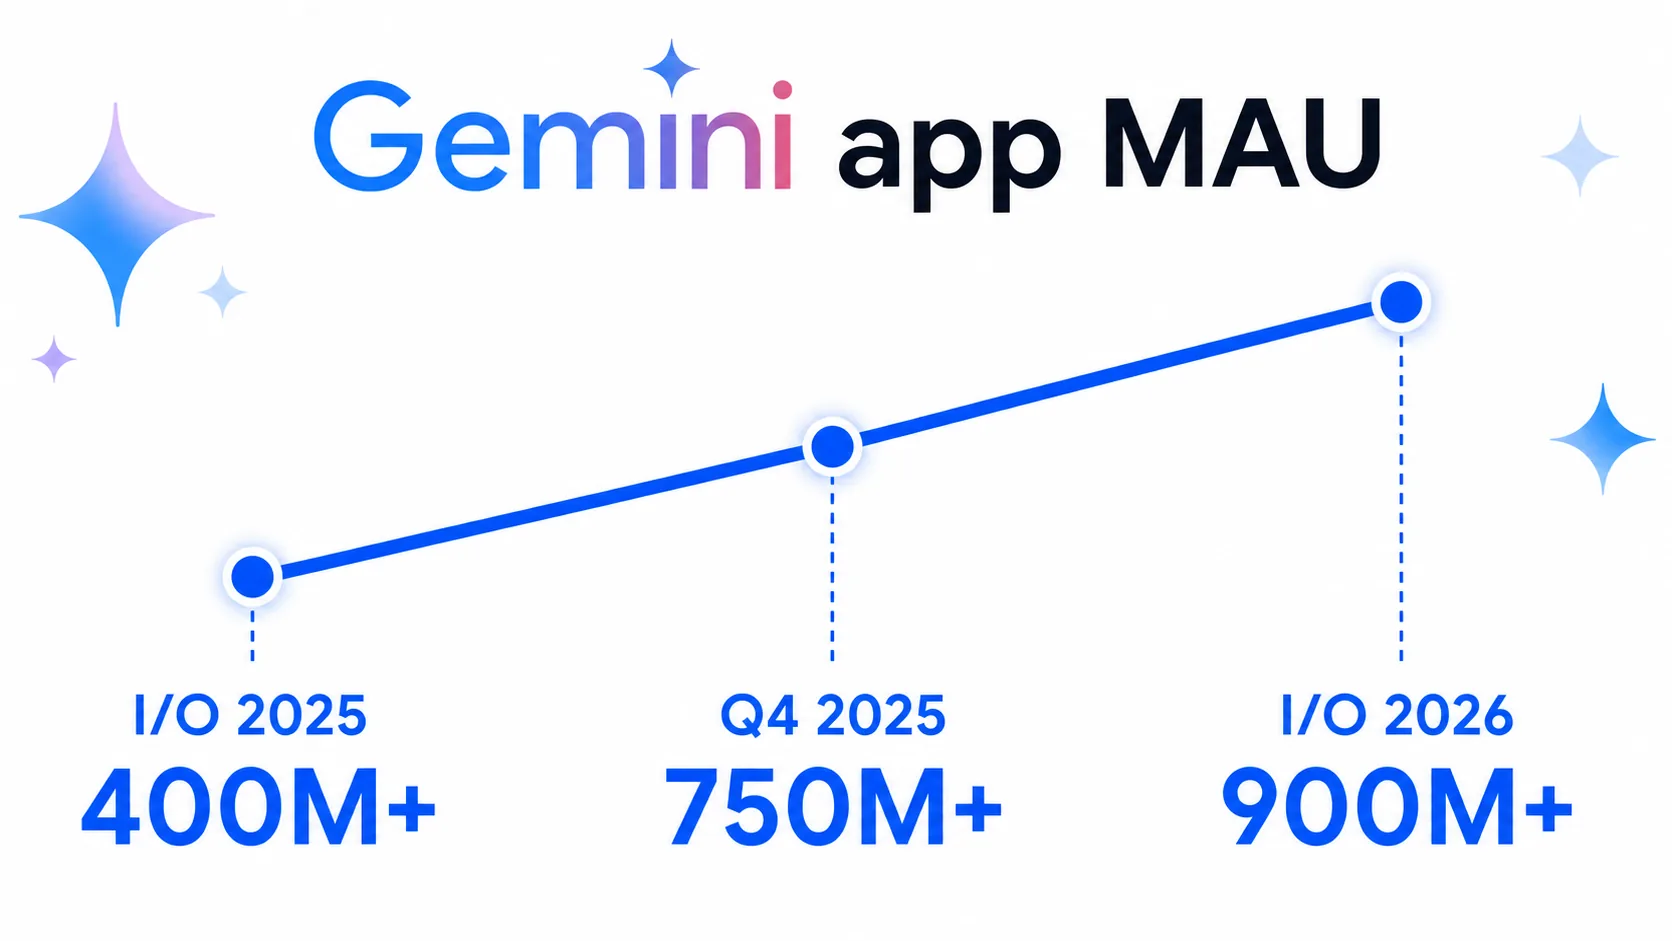
These figures show growth in disclosed app usage, but they should not be treated as a cohort-retention series: Google does not provide, in the cited materials, the exact MAU definition, daily active users, retention, session counts, average prompts, geography, or paid/free composition. A related caveat concerns paid subscriptions — Alphabet said paid subscriptions across YouTube, Google One, and related offerings surpassed 270 million in Q1 2025 (Alphabet Q1 2025), which is not a Gemini paid-user statistic.
Search Distribution: AI Overviews and AI Mode
Search is the largest distribution surface in the dossier, but Search usage is not the same as Gemini app usage. AI Overviews reached 1.5 billion monthly users at I/O 2025, exceeded 2 billion by Q2 2025, and reached 2.5 billion by I/O 2026 (Google I/O 2026). AI Mode, a separate conversational Search surface, surpassed 1 billion monthly active users by I/O 2026.
AI Overviews monthly users
Source: Google I/O and Alphabet earnings. AI Mode separately reached 1B+ MAU by I/O 2026. These are Search events, not Gemini app usage.
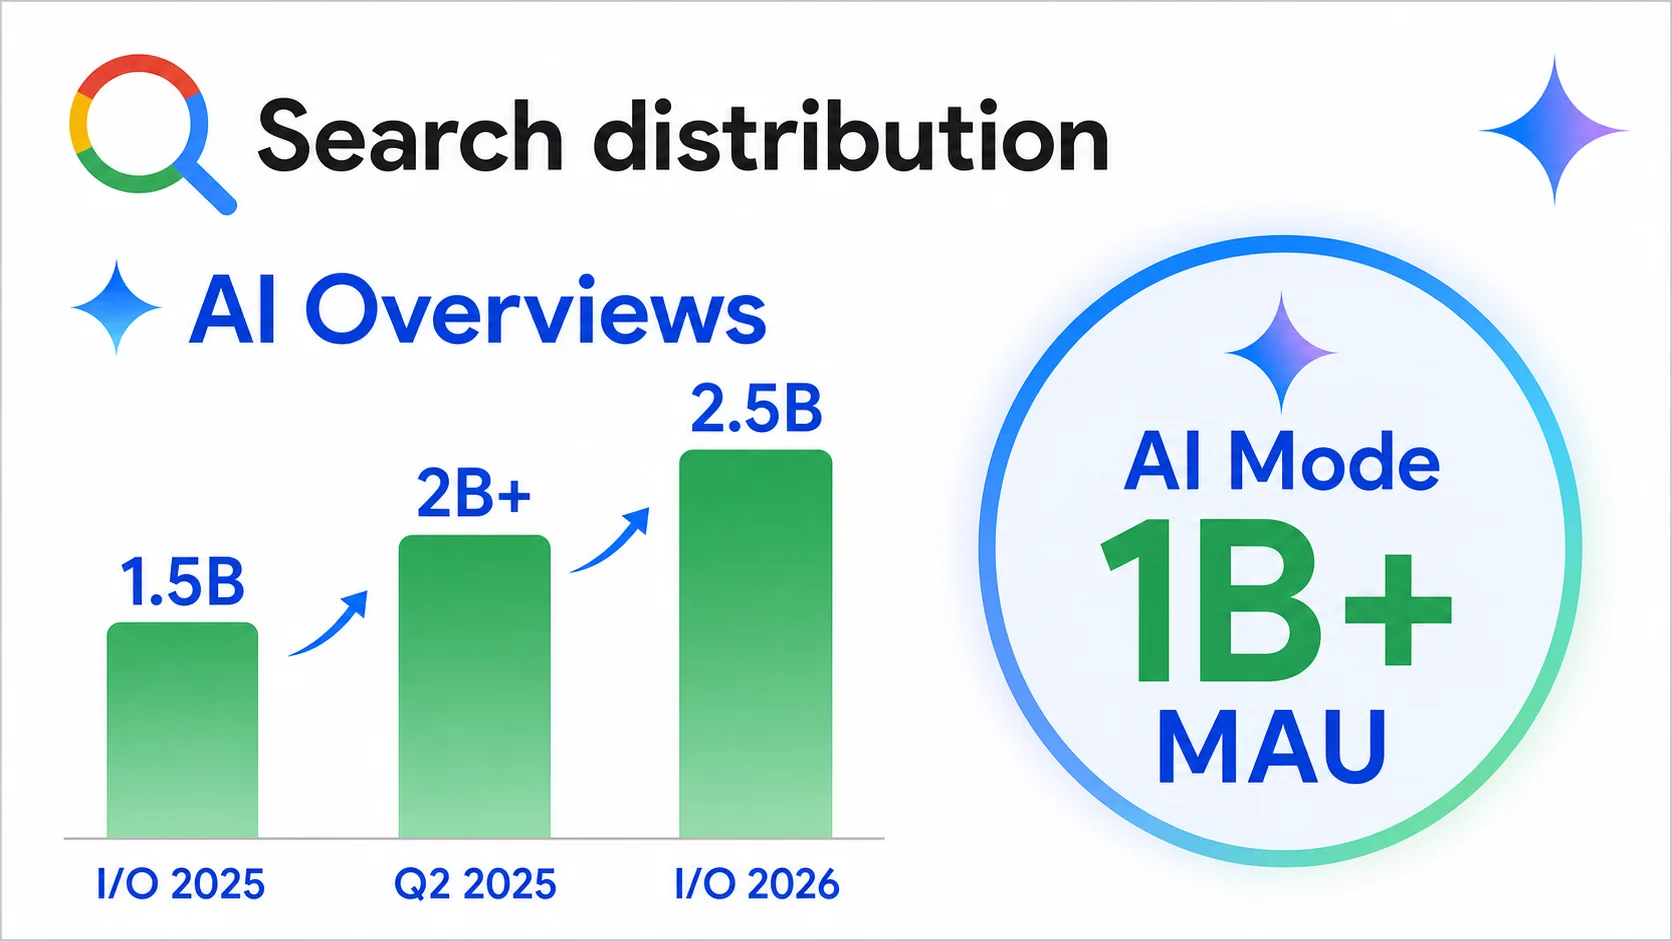
“Powered by Gemini” is not the same as “using the Gemini app.” Alphabet stated that AI Overviews were powered by Gemini 2.5 in Q2 2025 materials (Alphabet Q2 2025) — but the usage event still occurs in Search. The best interpretation: Search gives Gemini models very broad distribution, while the Gemini app figure is the cleaner measure of the standalone assistant’s active user base.
Token Processing and Infrastructure Scale
Token statistics are among the most dramatic Gemini-related disclosures — and among the easiest to overinterpret. Google said it processed 480 trillion tokens per month across products and APIs at I/O 2025, up from 9.7 trillion one year earlier, and 3.2 quadrillion tokens per month across Google surfaces by I/O 2026 (Google I/O 2026).
Tokens processed per month across Google surfaces
Source: Google I/O. Values in trillions; 3.2 quadrillion = 3,200 trillion. Combines multiple surfaces — not Gemini app traffic.
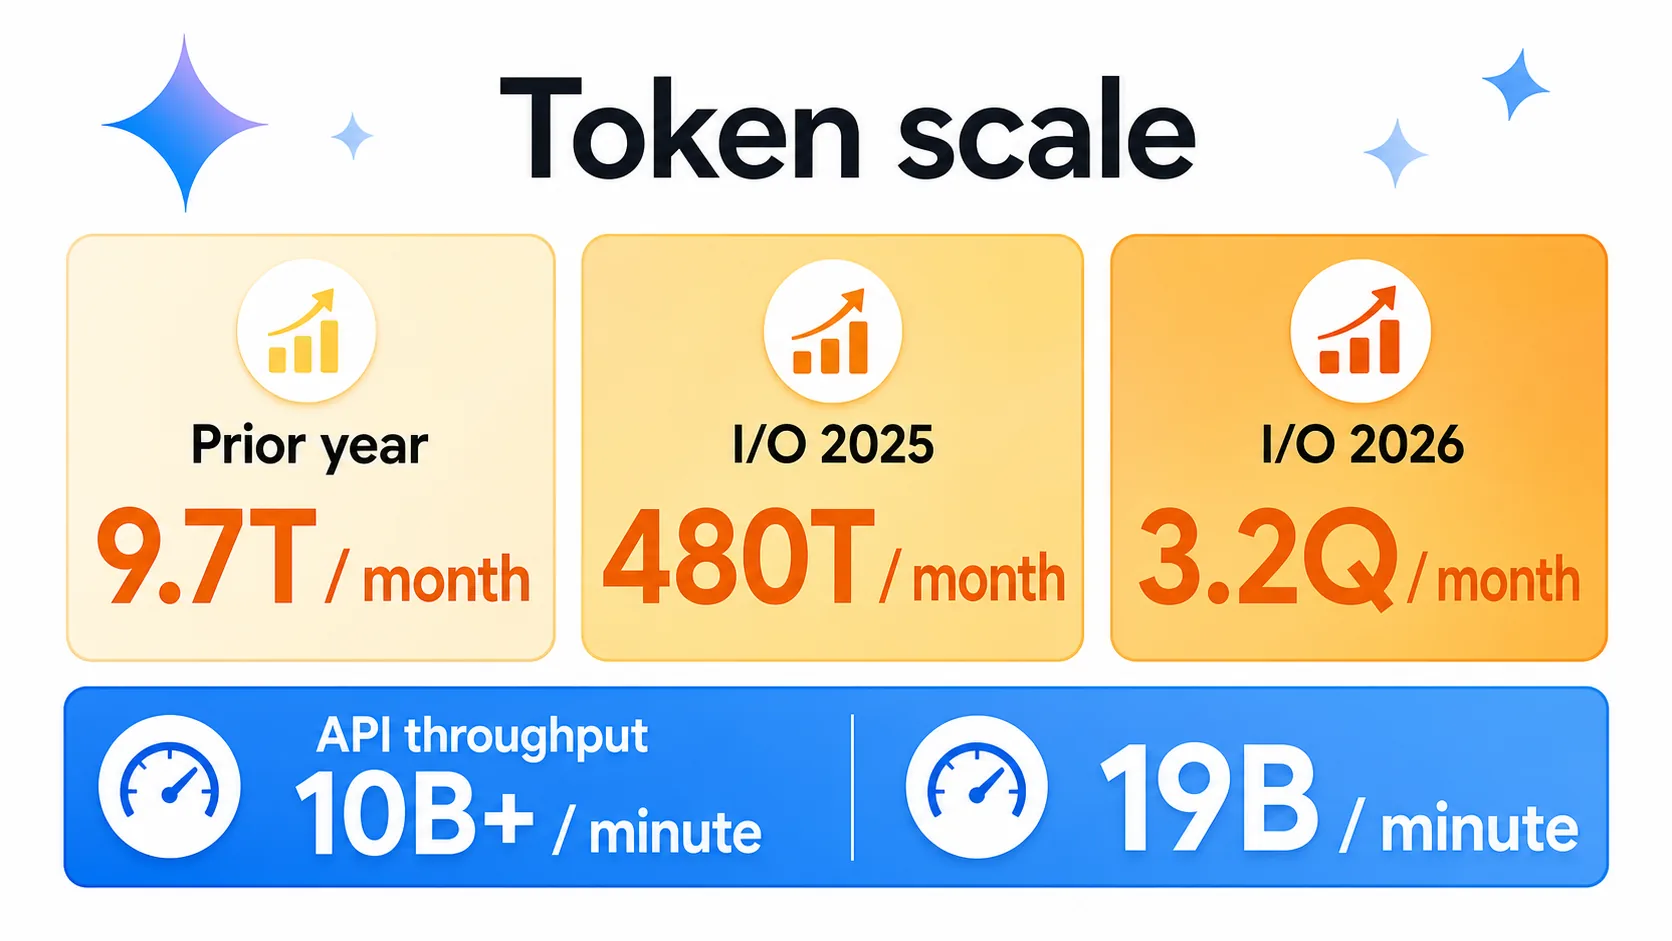
A token is a unit of model input or output processing, and token counts can rise from more users, longer prompts, longer outputs, larger context windows, multimodal workflows, agentic tool use, or background processing. The same user count can generate very different token volumes. Long-context capability compounds this: Gemini 2.5 materials discuss evaluations up to 1 million tokens, so a small number of enterprise, coding, or document-processing workloads can consume far more tokens than many short consumer chats. Token volume is a strong indicator of infrastructure scale, but a weak proxy for unique users, revenue, or engagement.
Developers, APIs, and Vertex AI
Google has reported several developer-ecosystem metrics. At I/O 2025 it said over 7 million developers were building with Gemini; by I/O 2026, 8.5 million were building with Google’s models monthly (Google I/O 2026). The wording differs — “building with Gemini” versus “building with Google’s models monthly” — so the two are related but not identical definitions.
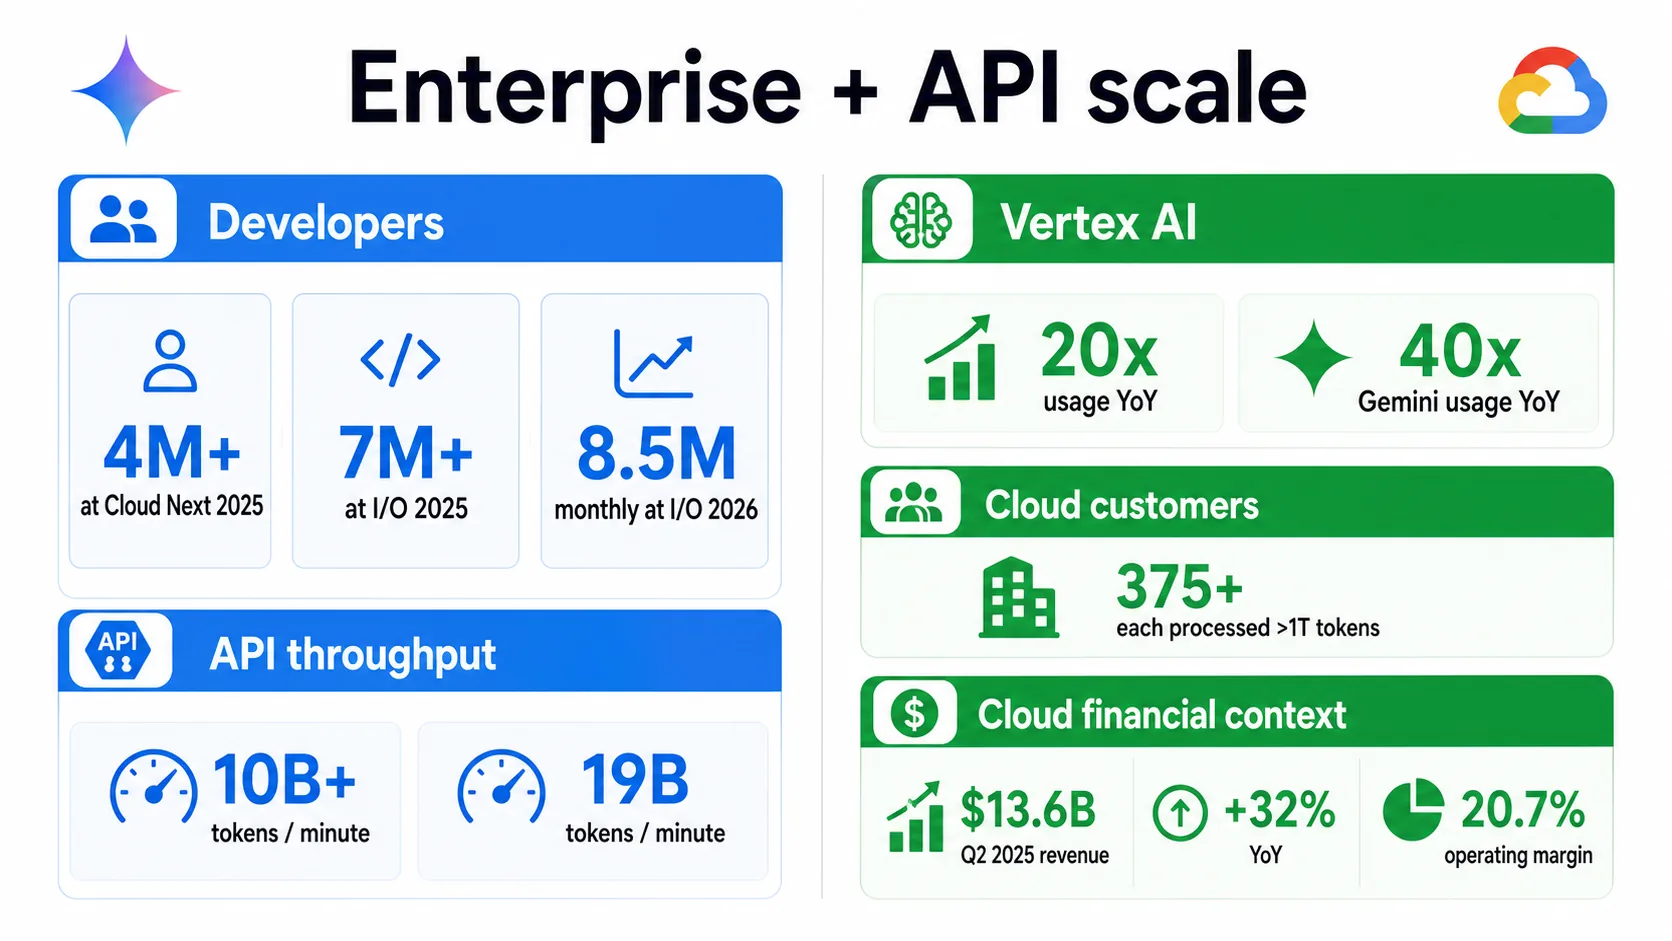
Google Cloud gave a platform view at Cloud Next 2025: Vertex AI usage was up 20× year over year, Gemini usage on Vertex AI up 40×, and the platform saw billions of API calls per month (Google Cloud Next 2025). These are ecosystem metrics, not counts of deployed applications, paying customers, or active end users. External developer surveys provide context, not market share: Stack Overflow’s 2025 materials say GPT models were the most-used LLMs among respondents, followed by Claude Sonnet and Gemini Flash (Stack Overflow) — which supports “Gemini Flash has meaningful developer usage,” not “most developers use Gemini.”
Enterprise, Cloud, and Financial Context
Gemini’s enterprise story is mostly visible through Google Cloud, Vertex AI, API usage, and Alphabet’s financials. By I/O 2026, more than 375 Google Cloud customers had each processed more than 1 trillion tokens during the previous 12 months (Google I/O 2026) — a threshold statistic, not a total customer count or total enterprise token volume.
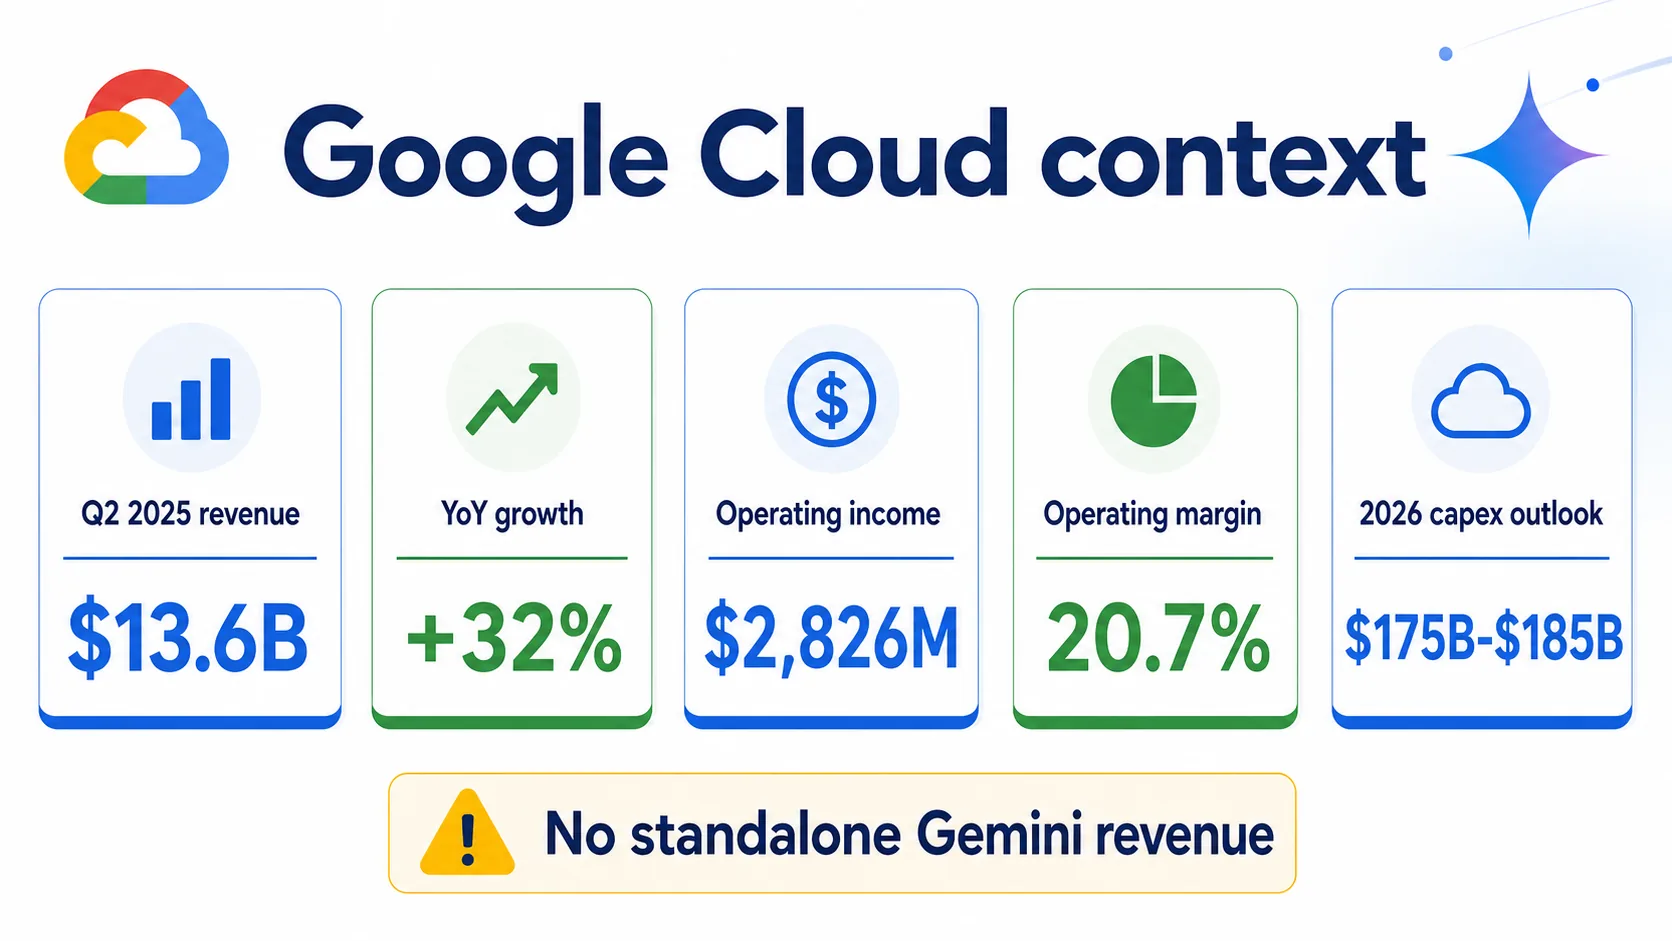
Google Cloud revenue was $12.3 billion in Q1 2025 (up 28% YoY) and $13.6 billion in Q2 2025 (up 32% YoY, at a 20.7% operating margin), with an annual run rate exceeding $50 billion by Q2 2025 and over $70 billion by Q4 2025 (Alphabet Q2 2025). Alphabet raised its 2025 capex outlook to approximately $85 billion and gave a 2026 outlook of $175–185 billion (Alphabet Q4 2025).
Product Surfaces: Workspace, Android, Chrome, Pixel, and NotebookLM
Gemini’s usage footprint extends across multiple Google products, but the disclosures differ by surface. The consumer app has MAU figures; Search has AI Overviews and AI Mode figures; other surfaces are documented mainly through availability, feature launches, and licensing rather than public user counts.
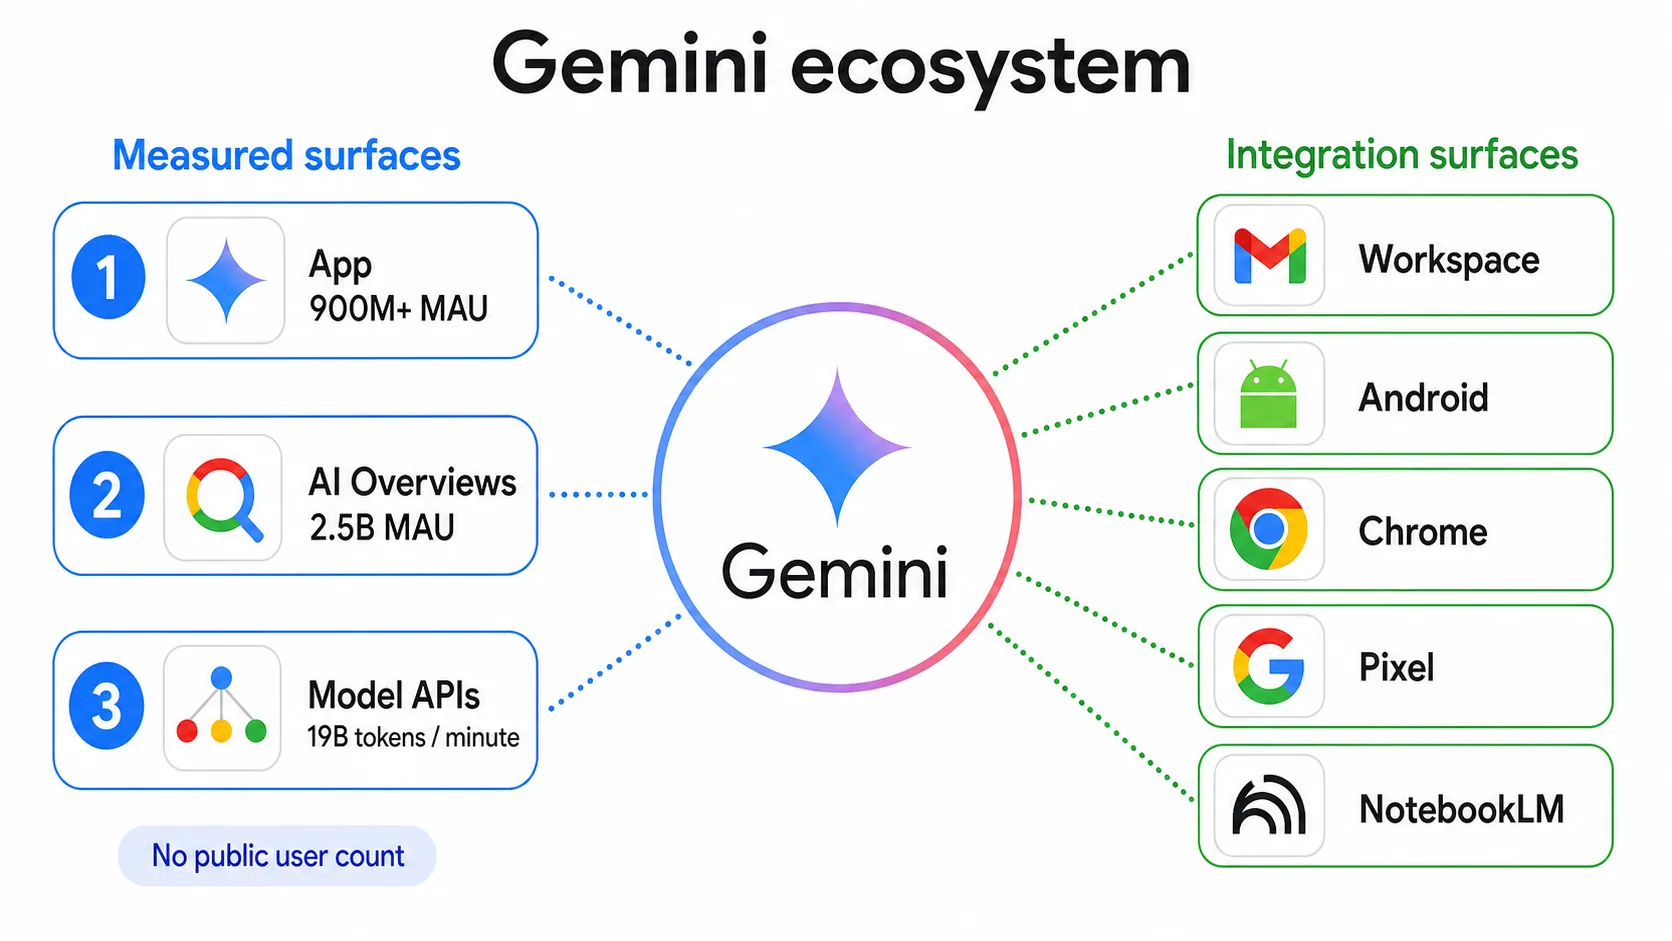
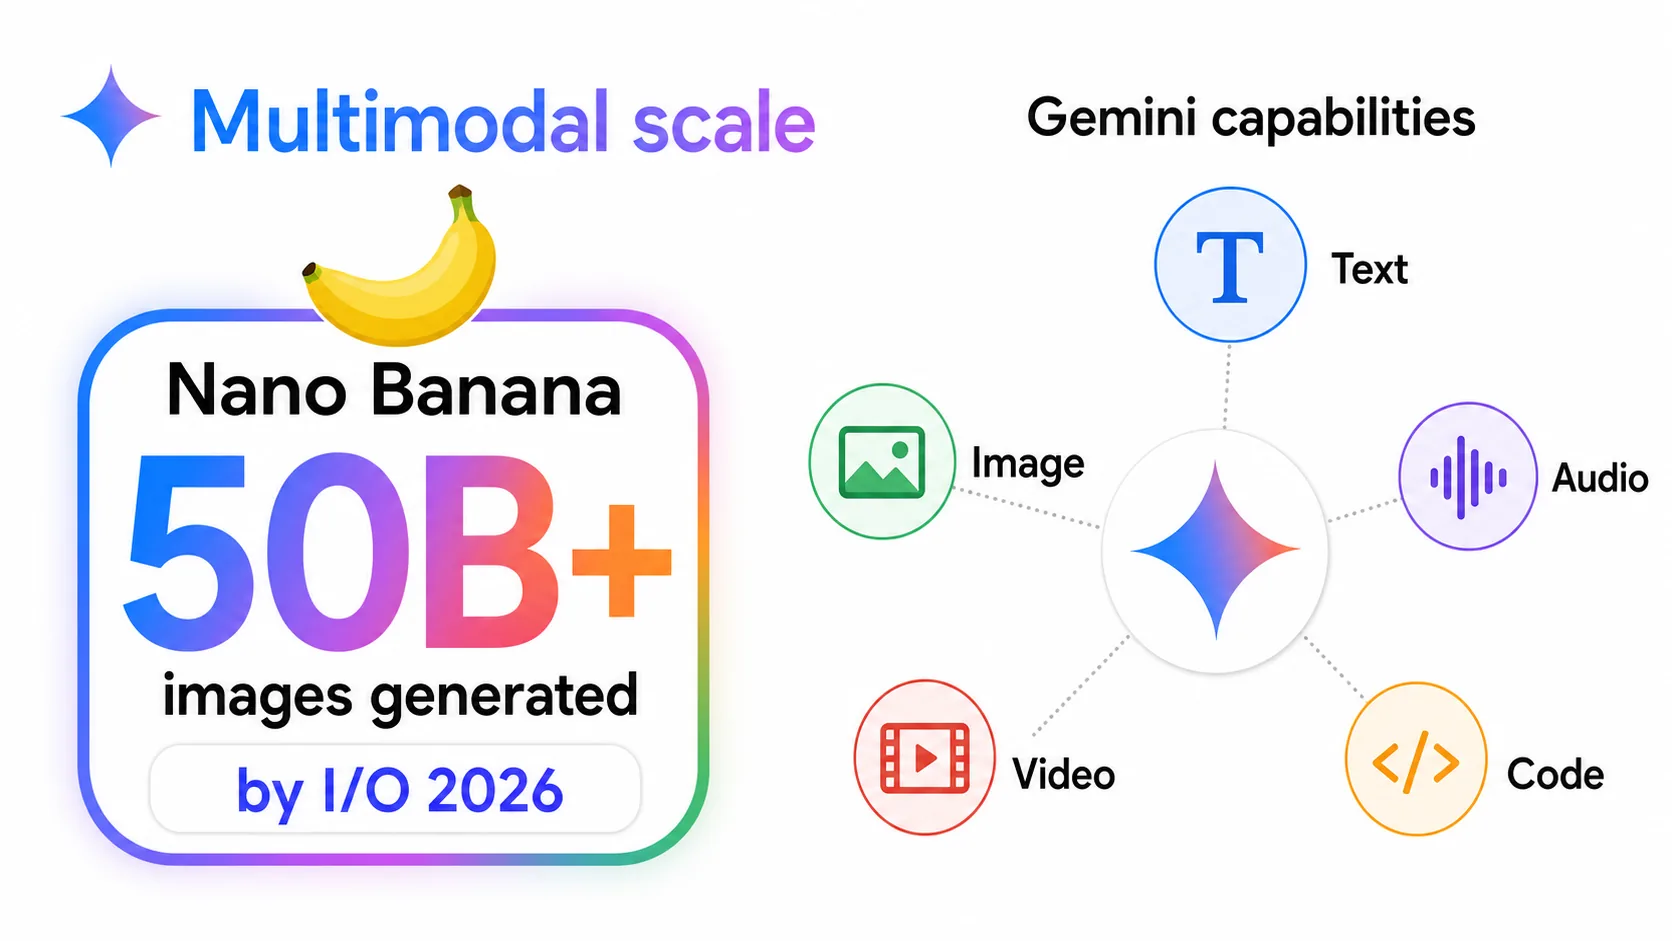
In Workspace, Gemini availability is governed by account settings, licensing, and admin controls (Google Help). On Android, Gemini is both an app and an integrated assistant, but the cited sources give no separate Android-only MAU (Gemini on Android). Chrome, Pixel, and NotebookLM are similar — product-surface sources rather than user-count sources. The recurring rule: product integration is not the same as measured adoption. A related multimodal disclosure does carry a number — more than 50 billion images generated with Nano Banana models by I/O 2026.
Model Capability and Benchmark Statistics
Gemini statistics also include model-evaluation results — different from adoption metrics. These measure benchmark performance, human preference, long-context behavior, and multimodal reasoning.
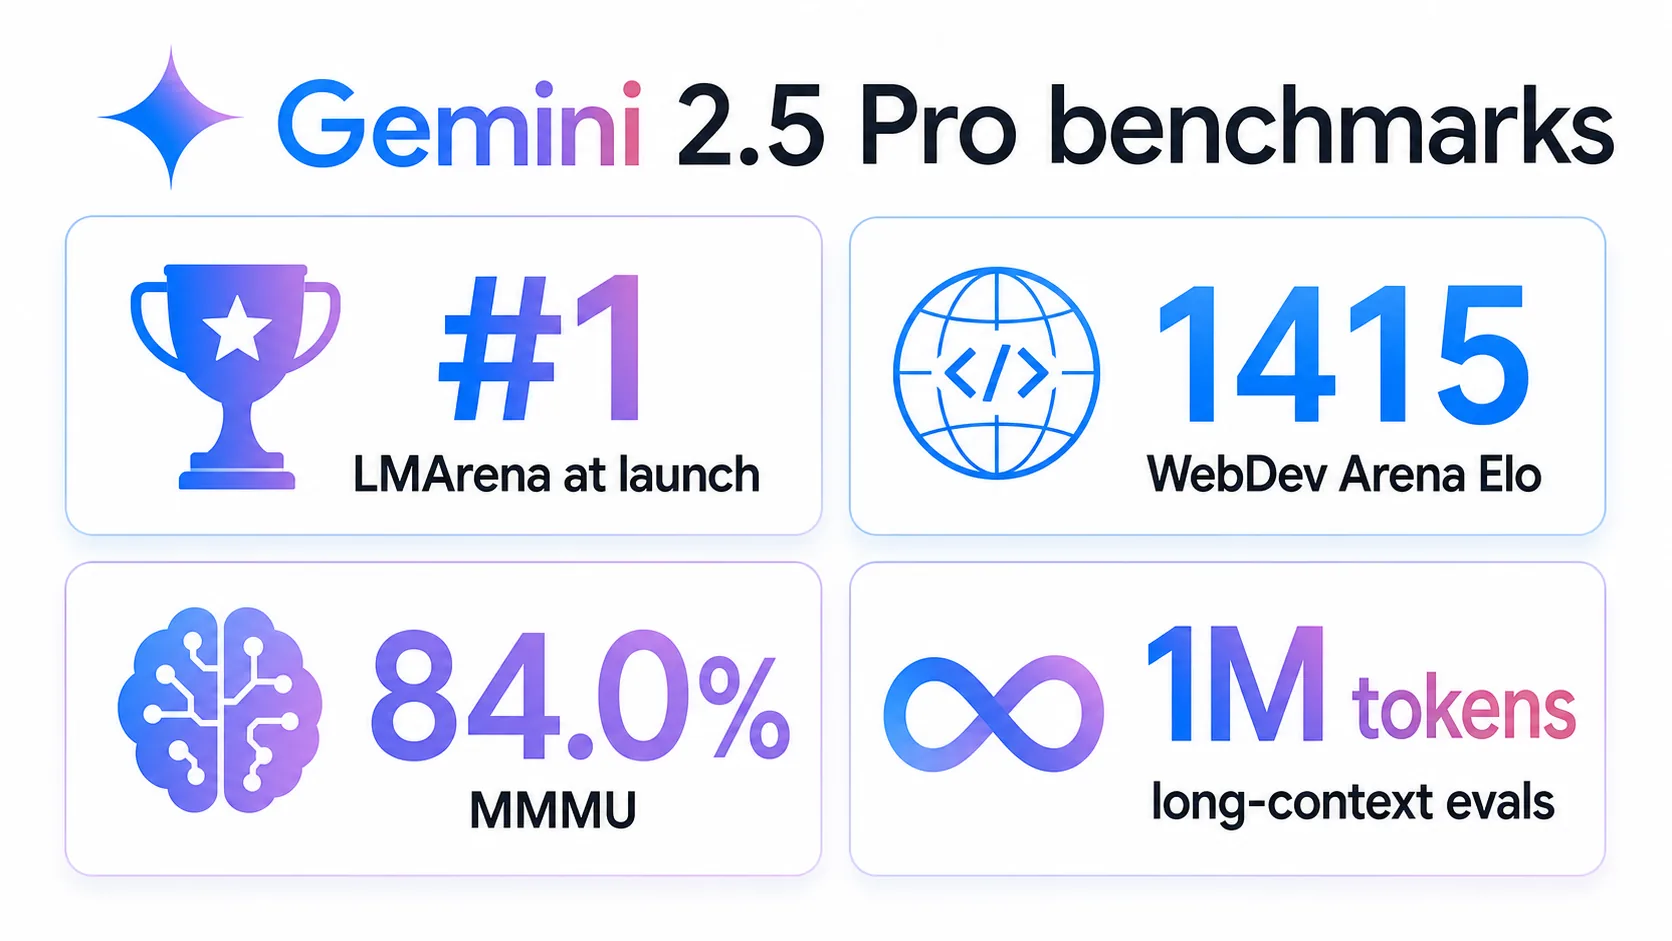
Google DeepMind said Gemini 2.5 Pro Experimental was #1 on LMArena at launch (Google DeepMind) — a live human-preference leaderboard, so rankings can change. Its I/O 2025 update reported a WebDev Arena Elo of 1415 and 84.0% on MMMU for the updated Gemini 2.5 Pro (Google DeepMind). These are meaningful only with methodology attached: pass@1 is not majority voting, human-preference Elo is not factual accuracy, coding benchmarks may use scaffolds, and live leaderboards are moving targets. The Gemini 2.5 technical report and model cards are the canonical sources for that methodology (Gemini 2.5 report).
Statistics Google Has Not Disclosed
Several frequently searched Gemini statistics are not supported by the authoritative source base in the dossier.
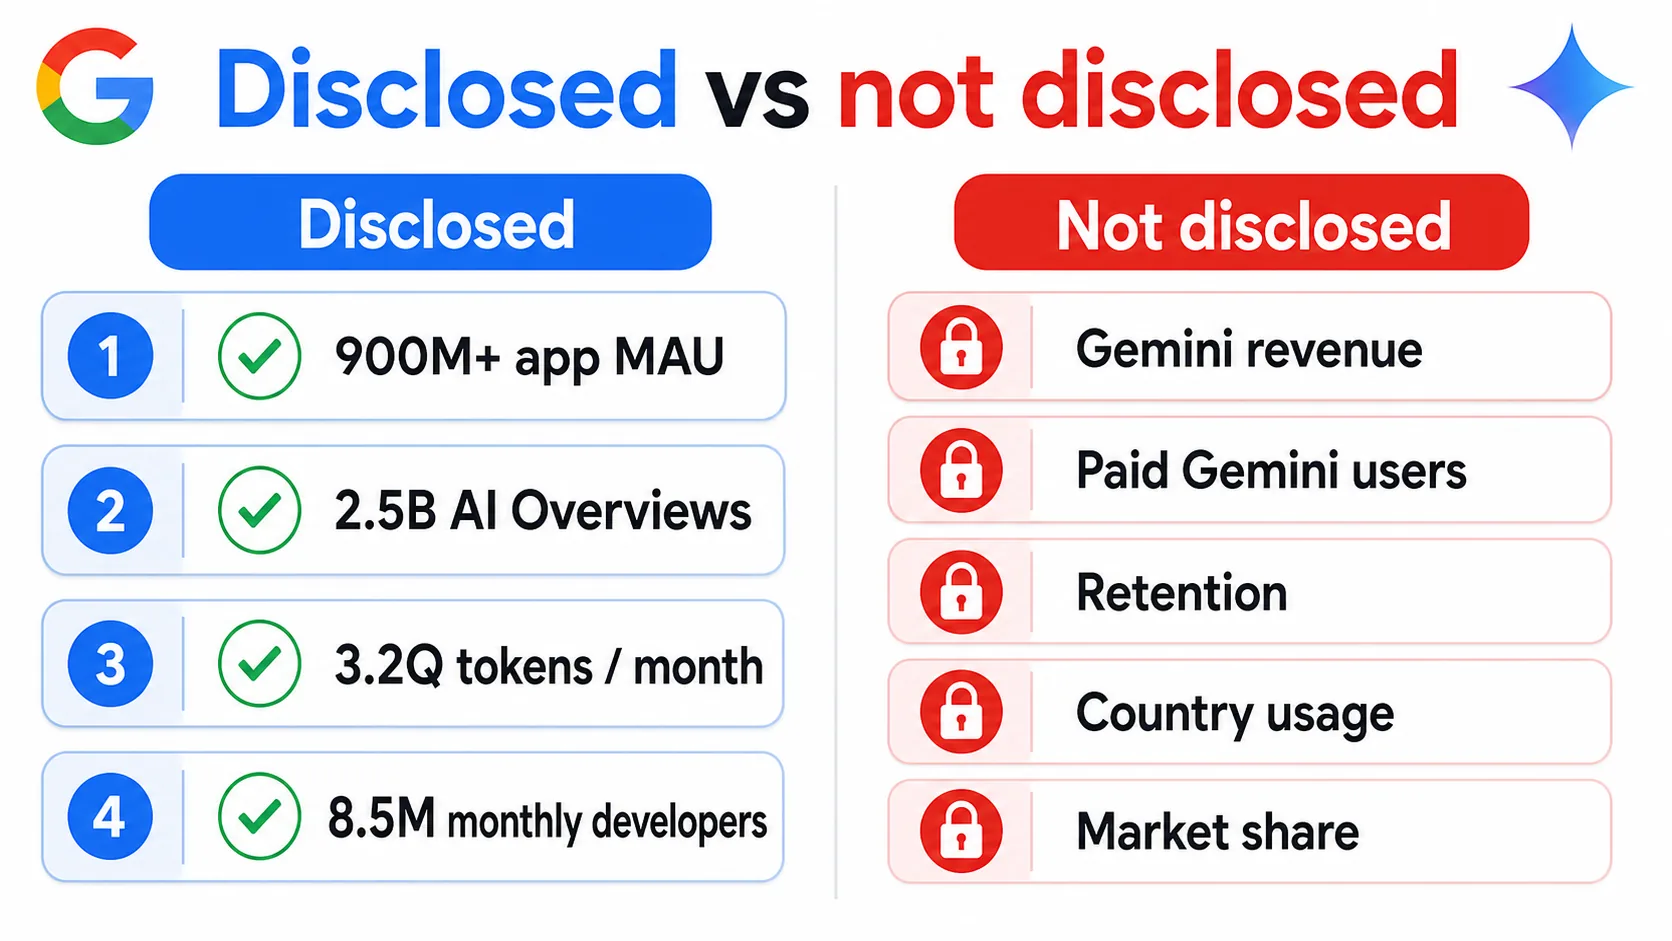
No standalone Gemini revenue.
Alphabet reports total revenue, Google Cloud revenue, operating income, subscriptions, and capex — but not Gemini revenue as a separate segment.
No reliable Gemini paid-subscriber count.
The 270M+ paid-subscription figure covers YouTube, Google One, and related offerings, not Gemini specifically.
No retention or DAU/MAU depth.
No retention, DAU/MAU, average prompts per user, or session length in the cited sources. MAU figures show reach, not engagement depth.
No country-by-country usage.
Availability pages show where features are supported, which is different from geographic usage shares.
No authoritative global market share.
Stack Overflow can compare model usage among respondents, but that is not global consumer, developer, or enterprise AI market share.
Source Quality Note
The strongest sources for Gemini statistics are official Google and Alphabet disclosures. Google I/O posts are useful for company-wide operational metrics; Alphabet earnings materials and SEC filings are best for financial context; official documentation is preferable to commentary for developer facts; and Google DeepMind technical reports and model cards are stronger than marketing summaries for capability.
Independent sources such as LMArena, WebDev Arena, Stack Overflow, JetBrains, GitHub Octoverse, and the Stanford AI Index are useful for context and benchmark interpretation, but they should not be stretched into unsupported claims about Gemini’s global market share or revenue. Claims such as “Gemini dominates enterprise AI,” “Gemini is the #1 AI coding assistant,” or “Gemini has X% global market share” should be rejected unless paired with a transparent, authoritative source — the dossier does not provide such evidence.
Frequently Asked Questions
How many people use the Gemini app?
Google reported the Gemini app had over 400 million monthly active users at I/O 2025, over 750 million in Q4 2025, and more than 900 million by I/O 2026. These are app MAU figures, distinct from Google Search usage.
How many people use AI Overviews and AI Mode?
AI Overviews reached 1.5 billion monthly users at I/O 2025, exceeded 2 billion by Q2 2025, and reached 2.5 billion by I/O 2026. AI Mode surpassed 1 billion monthly active users by I/O 2026. These are Google Search surfaces, not the standalone Gemini app.
How many tokens does Google process?
Google said it processed 480 trillion tokens per month across products and APIs at I/O 2025 (up from 9.7 trillion a year earlier) and 3.2 quadrillion tokens per month across Google surfaces by I/O 2026, with model APIs at roughly 19 billion tokens per minute. Token volume is an infrastructure metric, not a user count.
Does Google disclose Gemini revenue?
No. Alphabet reports total revenue, Google Cloud revenue, operating income, subscriptions, and capital expenditures, but it does not disclose standalone Gemini revenue as a separate segment in the cited earnings releases, calls, or annual report.
How many developers build with Gemini?
Google reported over 4 million developers building with Gemini at Cloud Next 2025, over 7 million at I/O 2025, and 8.5 million building with Google’s models monthly by I/O 2026. The wording of the definition changes across those disclosures.
Does Gemini have more users than ChatGPT?
The cited dossier does not establish a global market-share comparison. It discloses Gemini app MAU (900M+) and Search reach, but Google does not publish a deduplicated, cross-product user total or an authoritative market-share figure, so head-to-head market-share claims are not supported.
How does Gemini 2.5 perform on benchmarks?
Google DeepMind reported Gemini 2.5 Pro Experimental #1 on LMArena at launch, a WebDev Arena Elo of 1415, and 84.0% on MMMU, with long-context evaluations up to 1 million tokens. These are capability snapshots with methodology caveats, not adoption or accuracy guarantees.
Sources and Further Reading
Official Google & Alphabet scale metrics
App, Search, Workspace & product surfaces
Developer platform & API documentation
Model capability, benchmarks & independent context