AI Data Center Statistics
Last updated on July 15, 2026

AI demand is no longer only a model-quality story. It is now visible in electricity forecasts, megawatt leasing, hyperscaler capex, GPU revenue, AI server shipments, cooling design, power procurement, and grid queues. The hardest part is that those numbers do not measure the same thing. A TWh forecast is not online AI capacity. A planned gigawatt campus is not energized power. A GPU order is not a deployed cluster. A cloud revenue figure is not a data center capacity figure.
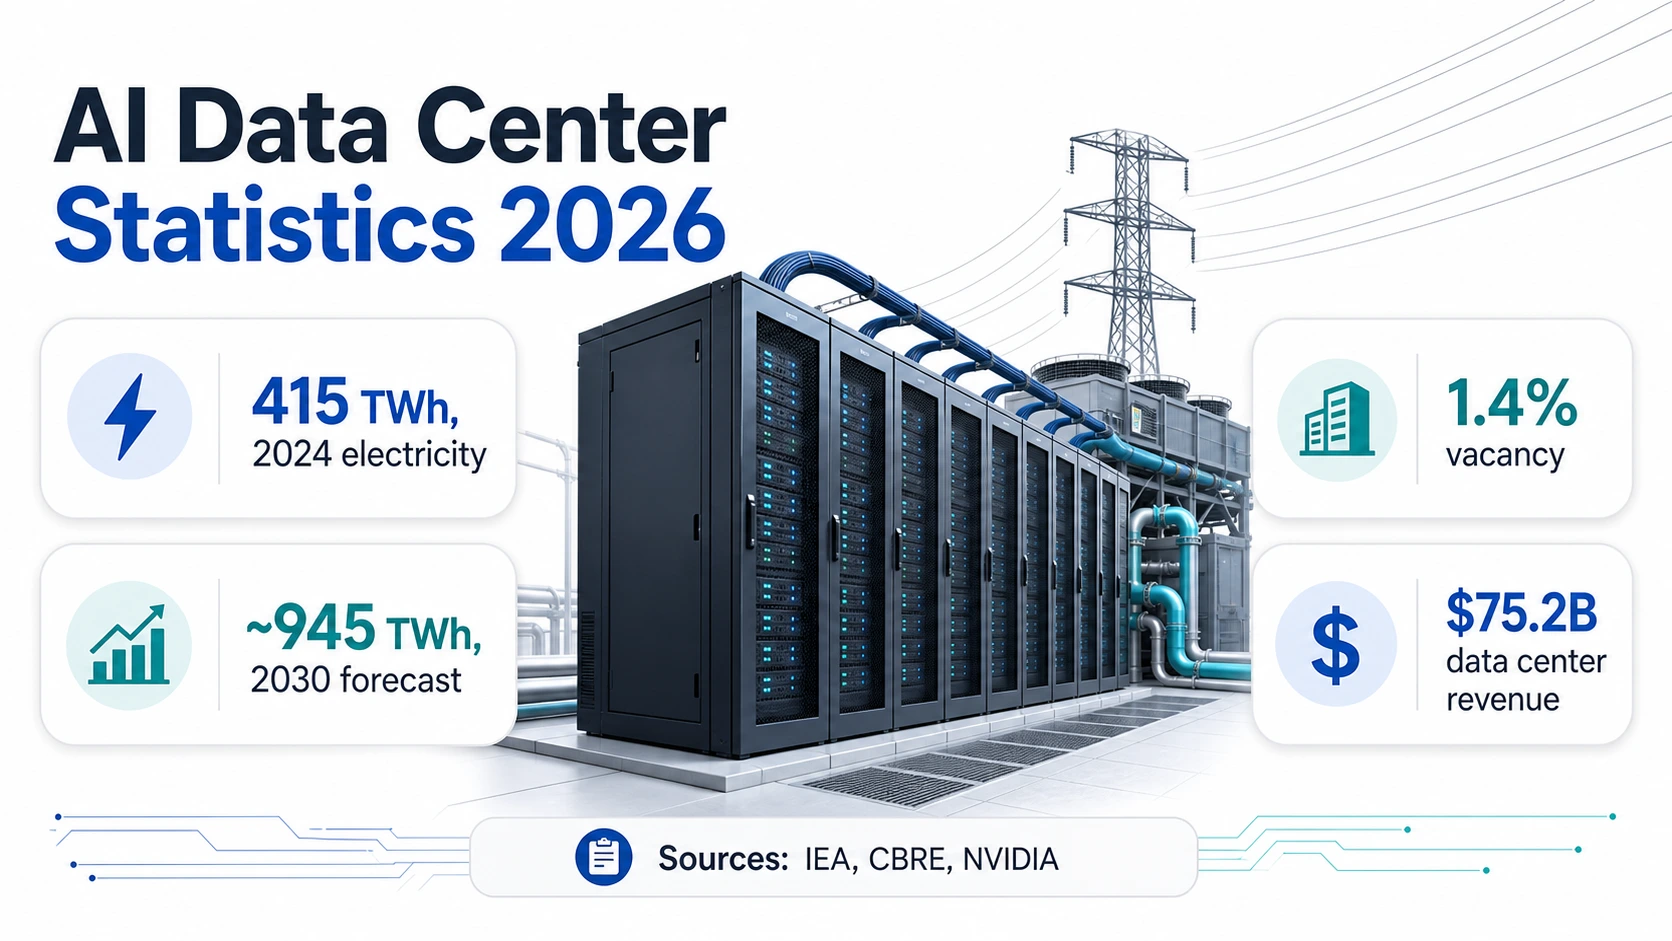
The clearest 2026 reading is a stack of related statistics. The IEA estimates global data centers consumed about 415 TWh in 2024 and could reach about 945 TWh in 2030. Berkeley Lab estimates U.S. data centers used 176 TWh in 2023 and could reach 325–580 TWh by 2028. CBRE reports North American primary-market data center vacancy fell to 1.4% at the end of 2025. At the same time, NVIDIA reported $75.2 billion in data center revenue in Q1 FY2027, and CoreWeave reported more than 1 GW of active power in Q1 2026.
Those are all AI infrastructure signals. They are not interchangeable. Read together, they show why AI data center capacity has become one of the practical constraints behind model access, cloud pricing, inference latency, and enterprise AI deployment.
The Headline AI Data Center Numbers
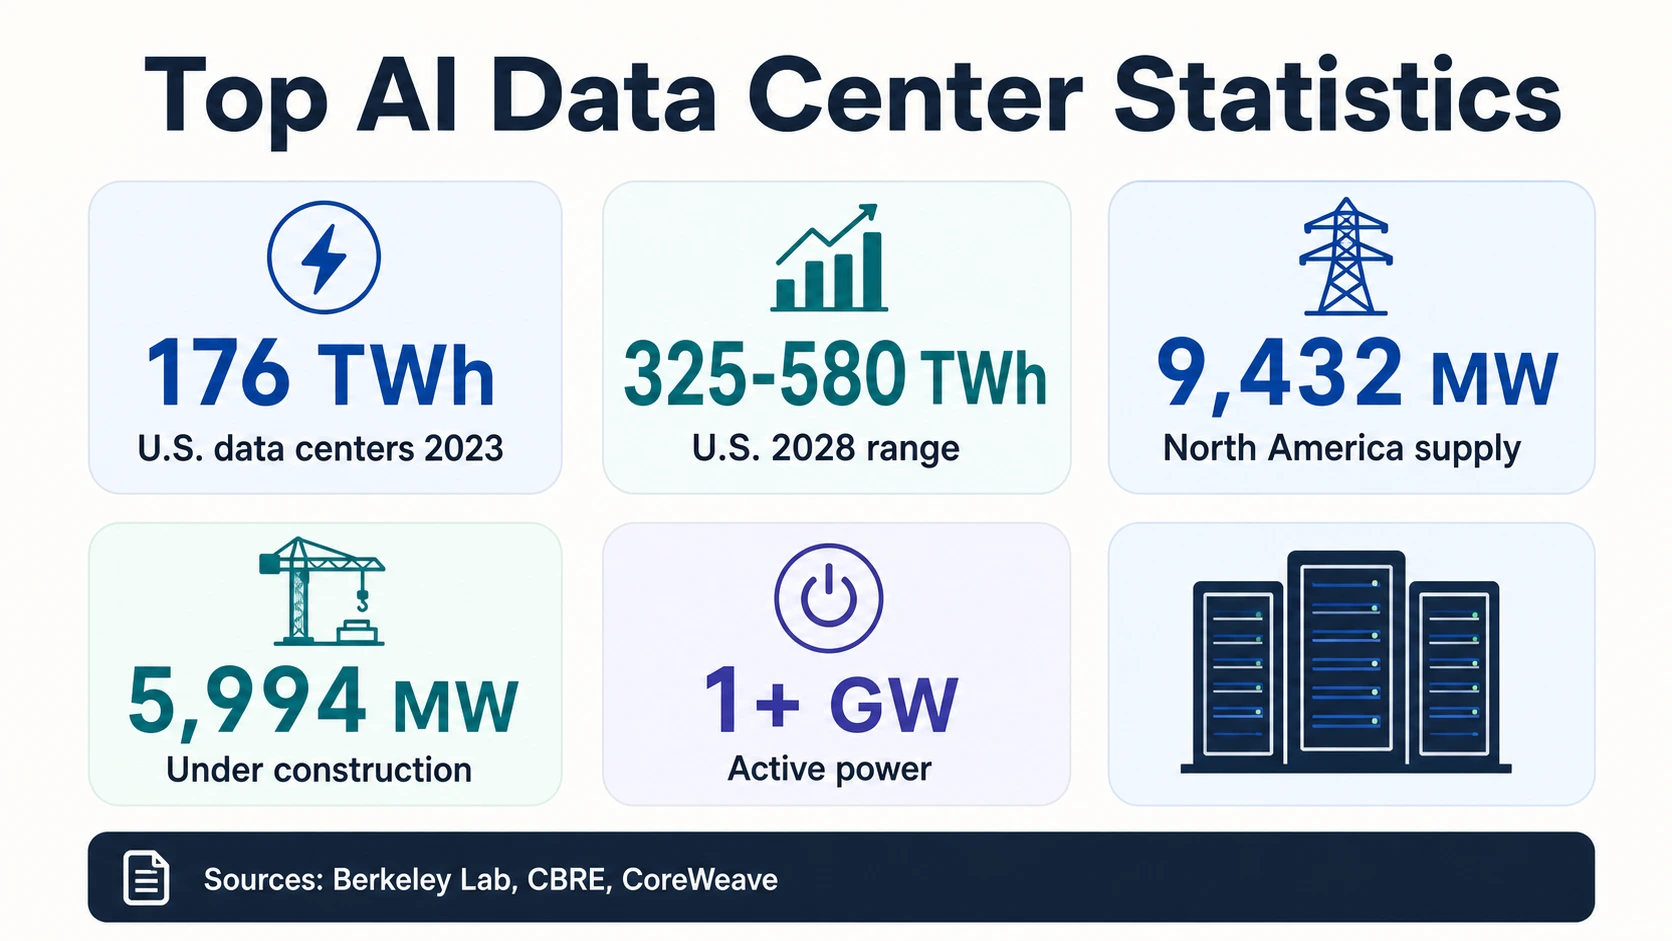
The top 2026 numbers use different denominators — electricity over time, power capacity at a point in time, market MW, and hardware revenue — so read each as a separate signal rather than one figure.
Electricity demand (energy agencies & labs)
Market supply, capex & hardware (operators, hyperscalers, vendors)
Read every number by its own denominator
AI data center statistics answer different questions. Tap a metric family to see what it measures — and what it does not prove.
IEA · CBRE · NVIDIA · CoreWeaveWhy The Units Matter: TWh, GW, And Capex
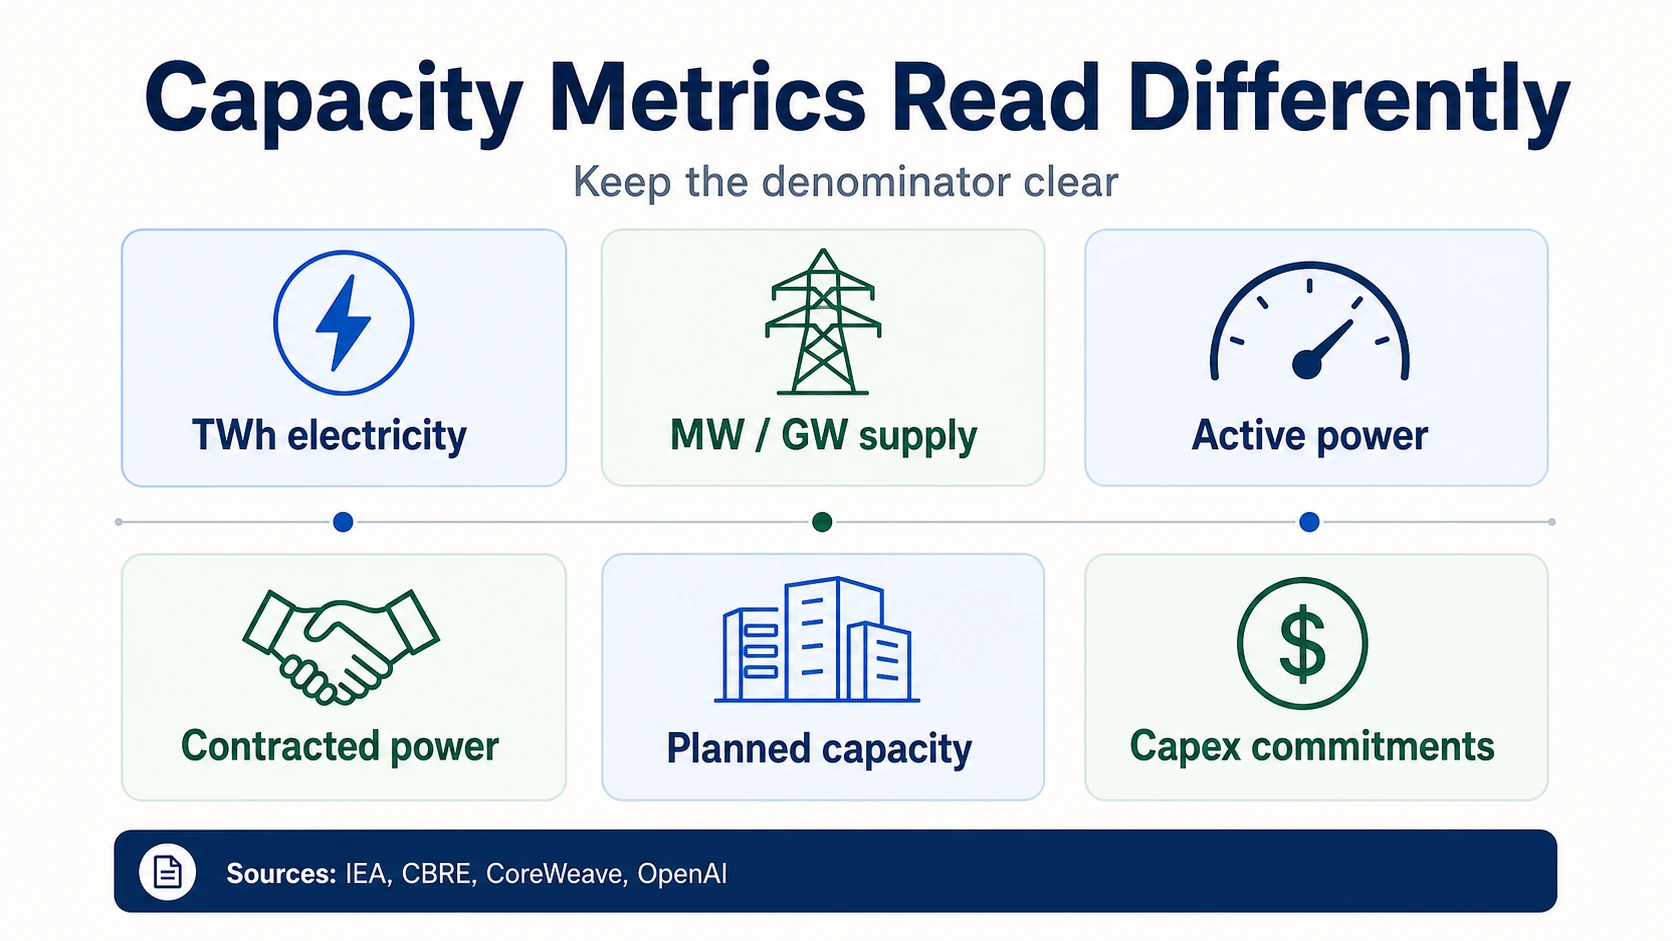
AI infrastructure statistics often look like they are pointing to the same constraint. They are not. TWh measures electricity consumed over time. MW and GW measure power capacity at a point in time. Supply can mean built data center capacity in a market, while under construction means future capacity that may already be preleased. Active power means power supporting current operations, while contracted power can refer to future power commitments. Capex is money committed or spent on assets, but capex does not show when a data center is energized.
That distinction matters because the AI buildout is happening faster than many public dashboards can cleanly measure. The IEA’s 415 TWh and 945 TWh figures describe global data center electricity demand, not AI-only electricity. The Berkeley Lab 176 TWh and 325–580 TWh figures describe U.S. data centers, not only GPU clusters. The CBRE 9,432 MW supply figure describes North American primary data center markets, not total global AI capacity.
Live footprint
CoreWeave 1+ GW active power
Proves a provider-level operational footprint — power supporting current operations.
CoreWeaveFuture commitment
CoreWeave 3.1 GW contracted power
Proves future supply commitments, not power that is online and serving customers today.
CoreWeaveAnnounced intent
Stargate nearly 7 GW planned
Proves announced infrastructure intent. These three numbers should never be merged into one available-capacity figure.
OpenAIThe same rule applies to GPUs. NVIDIA’s $75.2 billion Q1 FY2027 data center revenue proves extraordinary accelerator, networking, and data center platform demand. It does not prove how many GPUs are deployed, where they are installed, which customers can access them, or how much power is available for the racks.
Electricity Demand And Grid Pressure
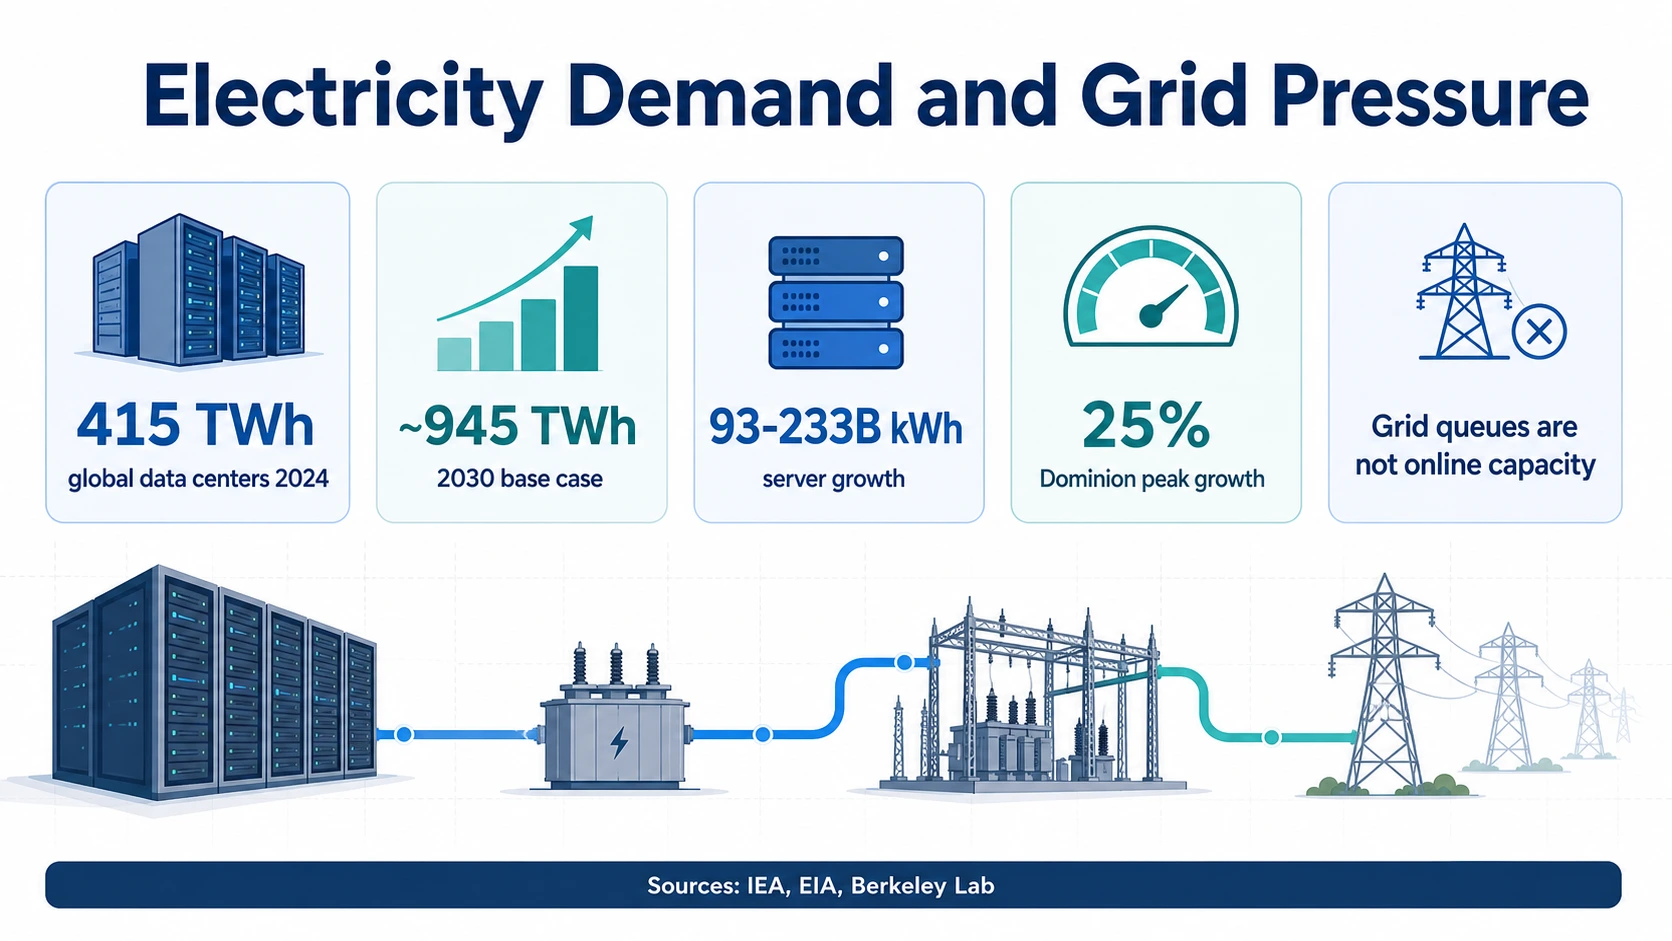
Electricity is the most visible denominator because AI workloads turn into server power, cooling power, substation needs, transmission needs, and procurement risk. The global baseline comes from the IEA: about 415 TWh of data center electricity in 2024 and about 945 TWh in 2030 under the base case. The same IEA report ties rapid growth to AI-optimized accelerated servers, which are projected to grow around 30% per year in the base case.
The United States has a sharper near-term curve. Berkeley Lab estimates U.S. data centers used 176 TWh in 2023, up from 58 TWh in 2014, and could use 325–580 TWh by 2028. In share terms, that means U.S. data centers could move from 4.4% of U.S. electricity in 2023 to a much larger share by the end of the decade, depending on growth and efficiency assumptions in the LBNL report.
U.S. data center electricity (TWh, Berkeley Lab)
2028 point plots the midpoint of the 325–580 TWh range; the range itself depends on growth and efficiency assumptions. Source: Berkeley Lab / LBNL.
U.S. data center electricity — history into a forecast band
Solid line is measured (58 TWh in 2014, 176 TWh in 2023). The shaded 2028 wedge is the full 325–580 TWh forecast range, not a single point — the fan is the uncertainty, driven by growth and efficiency assumptions.
Berkeley Lab / LBNLEIA’s 2026 modeling adds a narrower view. EIA AEO2026 focuses on server electricity consumption in the commercial sector and projects a 93–233 billion kWh increase from 2024 to 2030. That narrower denominator is useful because it isolates servers, but it should not be used as a full data center electricity estimate. Servers sit inside facilities that also need cooling, power distribution, backup systems, and network equipment.
The regional numbers are even more instructive for operators. EIA’s Dominion Energy Virginia-Carolinas analysis says electricity demand in that zone grew 6% in 2024 and that summer peak demand is expected to grow 25% from 2024 to 2030. Northern Virginia remains one of the world’s densest data center regions, so this is a useful power-market warning: data center growth is often local and grid-specific, even when AI demand is global.
The policy implication is not simply “build more data centers.” It is power delivery. DOE’s clean-energy page says data centers were about 4% of U.S. electricity in 2023 and could reach as much as 9% by 2030, citing EPRI-style analysis through the U.S. Department of Energy. PJM’s 2026 load forecast materials show why regional grid operators are adding more scrutiny around large loads. A data center can have land, capital, and servers lined up while still waiting on substations, transmission, permits, and firm power.
Capex, Hyperscalers, And Planned AI Infrastructure
The hyperscaler capex wave is one of the strongest signs that AI infrastructure has become a balance-sheet priority. It is also one of the easiest areas to misread. Company capex can include land, buildings, GPUs, CPUs, networking, data center electrical gear, leases, and non-AI cloud infrastructure. The right comparison is directional scale, not exact AI market share.
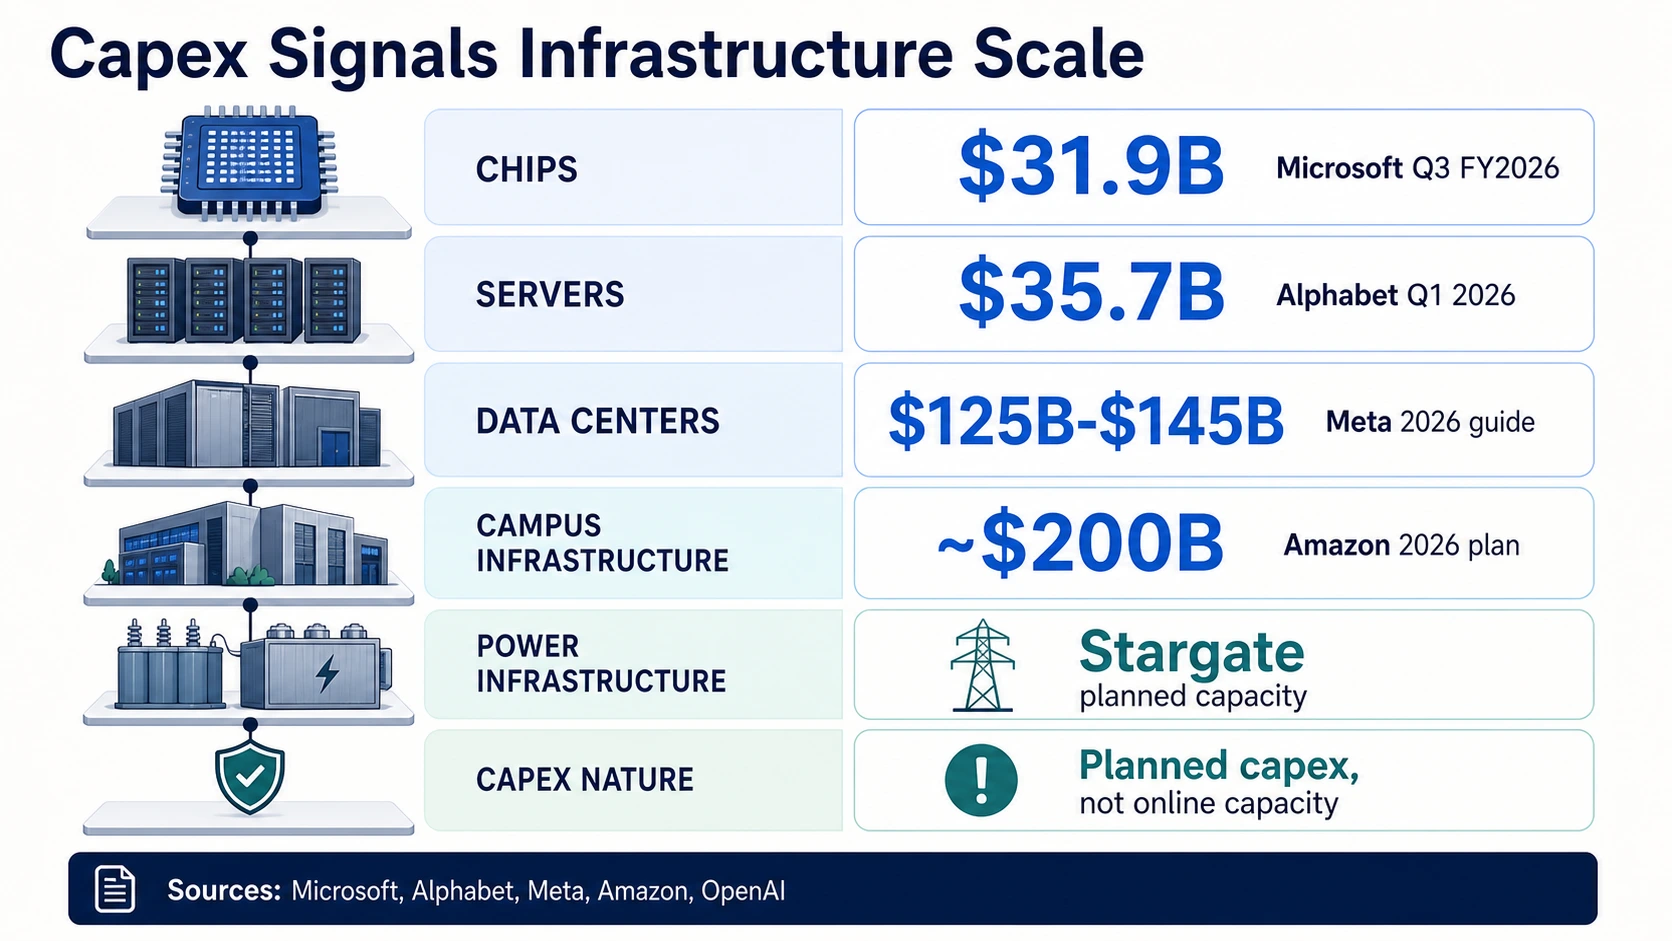
Microsoft’s Q3 FY2026 results give one useful split. Microsoft reported $31.9 billion in capital expenditures including finance leases, and management said roughly two thirds went to short-lived assets such as GPUs and CPUs. That split matters because it separates fast-depreciating compute from longer-lived data center and networking assets. It also shows why capex does not translate immediately into new supply: compute assets may arrive before the full campus, power, and network stack is available everywhere customers need it.
Alphabet offers a similar split. Alphabet reported $35.7 billion of Q1 2026 capex, primarily technical infrastructure for AI. The company said about 60% went to servers and about 40% to data centers and networking. That is useful because it shows AI infrastructure is both a chip/server problem and a real-estate/power/networking problem.
Meta’s guidance shows the scale of social-platform AI infrastructure. Meta raised 2026 capex guidance to $125 billion–$145 billion, including finance-lease principal payments. The finance-lease language matters: a number that includes lease principal payments is not directly comparable to a narrower purchase-only capex figure from another company.
Amazon’s capex framing is even larger. In the Amazon 2025 Annual Report, the company says it expects about $200 billion of capital expenditures in 2026, predominantly for AWS, and that a substantial portion is tied to customer commitments. That wording connects capex to demand, but planned 2026 capex is still planned capex. It is not already-spent capex, and it is not a direct measure of online AI data center capacity.
Oracle and OpenAI show another layer: contracted AI infrastructure and planned campuses. Oracle’s FY2026 results emphasize cloud infrastructure growth and remaining performance obligations tied to AI demand. OpenAI’s Stargate announcement described up to $500 billion over four years for U.S. AI infrastructure, while an OpenAI and Oracle update described nearly 7 GW of planned capacity and more than $400 billion over three years. Those are important commitment signals. They are not a guarantee that nearly 7 GW is live today.
GPU, AI Server, Memory, And Rack Supply
Compute supply is the second major denominator after power. NVIDIA’s data center segment is the cleanest public hardware-demand signal. NVIDIA reported $115.2 billion in FY2026 data center revenue, up 142% year over year. In Q1 FY2027, NVIDIA reported $75.2 billion in data center revenue, up 92% year over year.
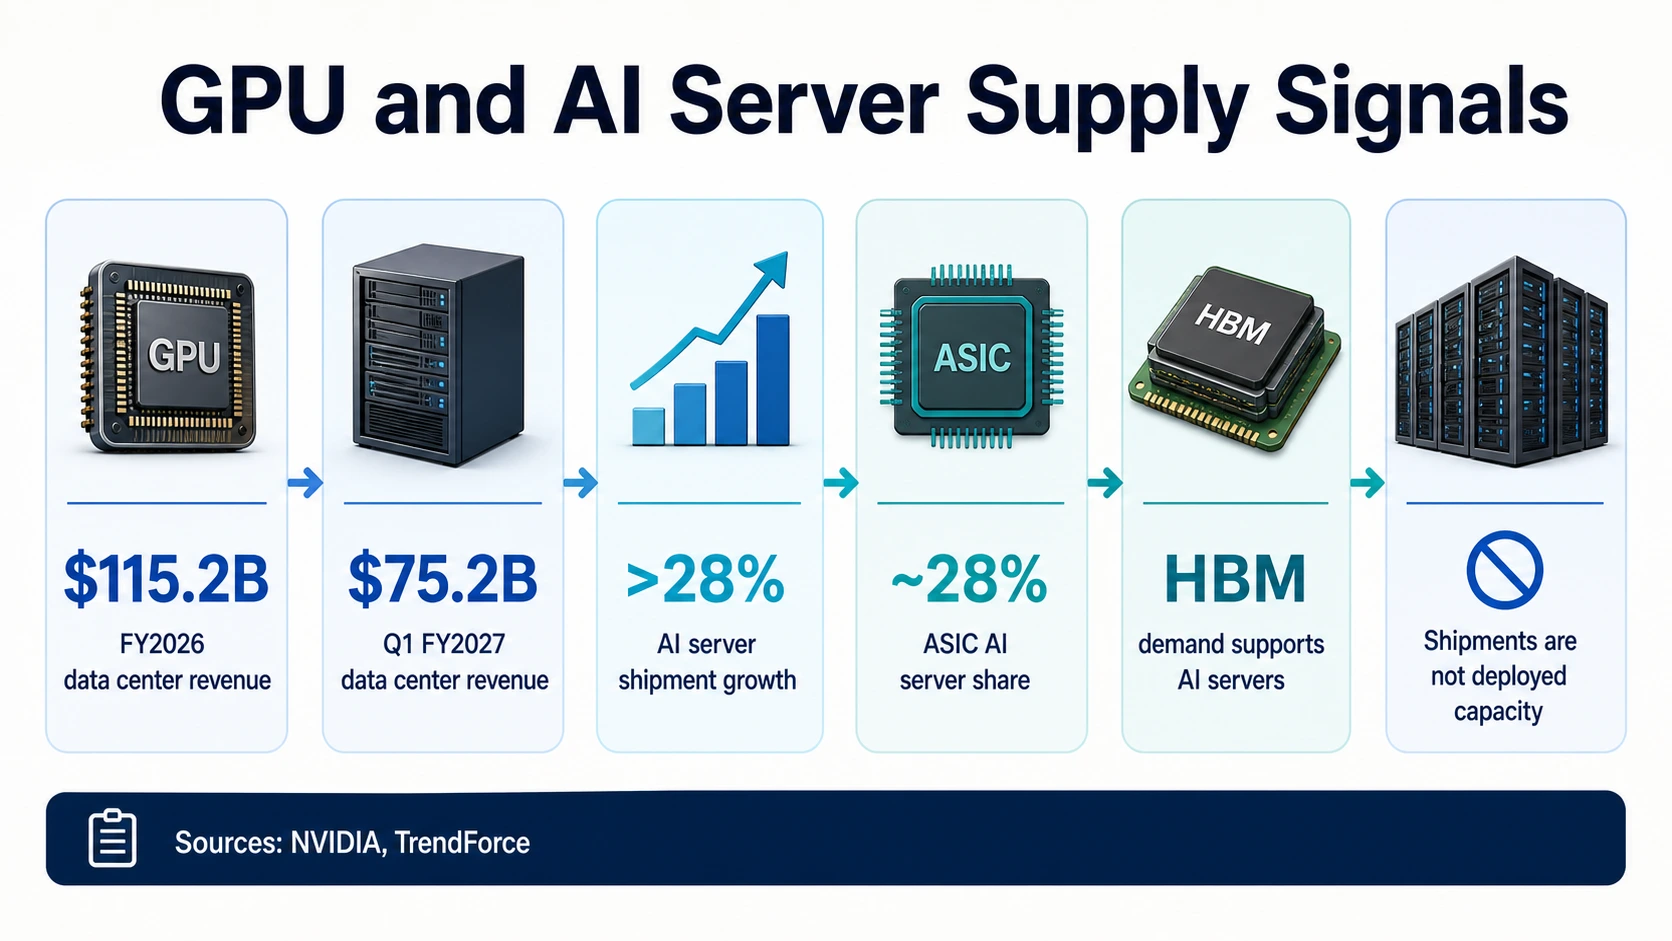
Those figures explain why AI data center conversations so often begin with GPUs. They should not end there. NVIDIA data center revenue includes accelerators, systems, networking, and platform components. It does not disclose a clean public count of GPUs deployed in every AI data center, nor does it show how much rack space or power is available where those GPUs are needed.
AI server shipment forecasts help fill in the supply-chain picture. TrendForce expects global AI server shipments to grow by more than 28% year over year in 2026, while ASIC-based AI servers approach 28% of AI server shipments. That suggests a broader AI hardware mix, not only GPU systems. It also hints at inference growth: as inference becomes a larger share of workloads, more specialized accelerators and ASIC-based systems can become economically important.
Memory and packaging are another bottleneck layer. TrendForce’s HBM coverage shows high-bandwidth memory demand tied to AI server growth. HBM is not a data center capacity metric, but it is a compute-supply constraint. A cloud provider can want more AI capacity and still face limits from accelerator supply, memory packaging, advanced networking, or power delivery.
Rack density makes the hardware story physical. Higher-density AI racks put more load into each room and each power chain. Uptime Institute’s Global Data Center Survey 2025 coverage highlights power, cooling, and density pressure across operators. That is why AI data centers increasingly look less like ordinary enterprise server rooms and more like power-dense industrial sites with specialized cooling, transformers, switchgear, and networking.
The practical takeaway: GPU availability is necessary, but not sufficient. A deployed AI cluster needs accelerators, servers, networking, storage, rack power, cooling, software, orchestration, and customer-ready capacity. Any statistic that stops at chip revenue or server shipments is only one layer of the stack.
Training Clusters And Inference Capacity Are Different Problems
AI data center demand is often described as one wave, but training and inference stress infrastructure differently. Training frontier models favors very large, tightly networked accelerator clusters. Those clusters need enormous contiguous power, high-speed networking, dense cooling, and reliable access to the same pool of accelerators for long jobs. That is the world implied by NVIDIA’s data center revenue growth, Microsoft’s GPU-heavy capex split, and Alphabet’s server-heavy AI infrastructure spending.
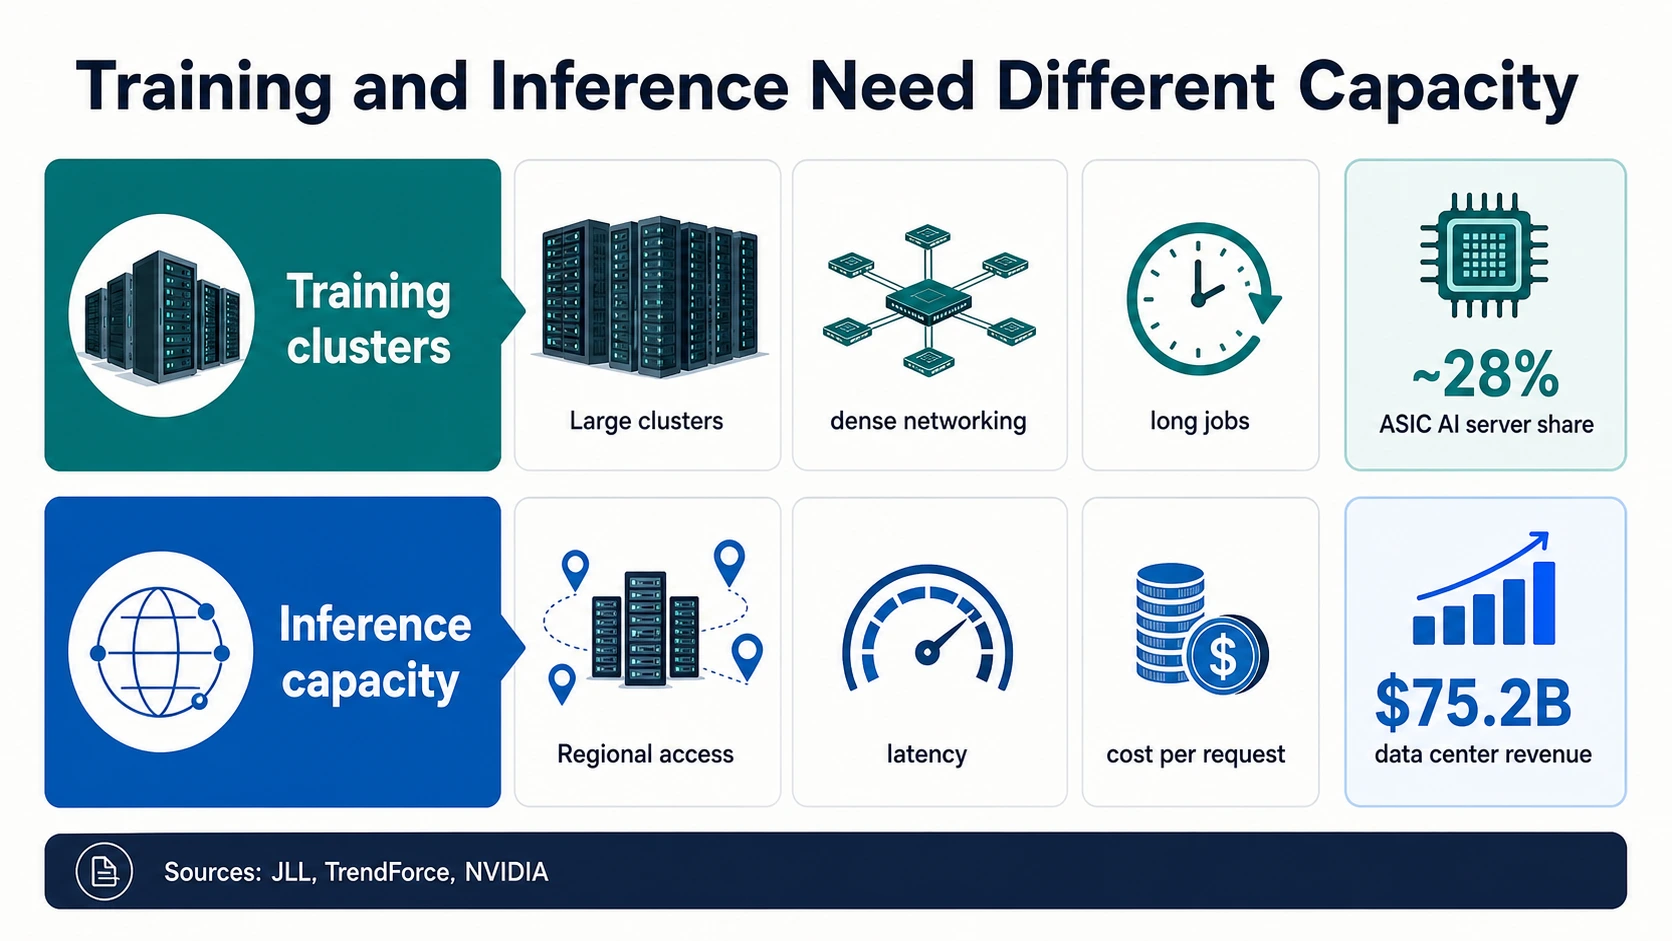
Inference has a different shape. Once AI products move into search, coding, customer support, enterprise workflows, ecommerce, analytics, and agentic automation, the infrastructure question becomes cost, latency, regional availability, and steady utilization. Inference can still use high-end accelerators, but it also creates demand for specialized accelerators, ASIC systems, optimized networking, and capacity closer to users and applications. That is why TrendForce’s forecast that ASIC-based AI servers could approach 28% of AI server shipments in 2026 is worth reading alongside GPU revenue.
Training vs. inference — two different capacity problems
Training frontier models needs enormous contiguous power, high-speed networking, dense cooling, and reliable access to the same accelerator pool for long jobs. Sited where large power blocks, land, and cooling can be secured.
Once AI products ship into search, coding, support, and agentic workflows, the question becomes cost, latency, regional availability, and steady utilization — driving demand for specialized accelerators, ASIC systems, and capacity near applications.
A large future campus does not automatically solve low-latency inference in a constrained metro. Tap each workload to see what it stresses.
JLL · TrendForce · NVIDIAThe distinction also affects geography. A training cluster may be located where very large power blocks, land, and cooling can be secured. Inference capacity may need to be closer to cloud regions, enterprise customers, consumer traffic, or regulated data locations. JLL’s global data center outlook points toward a major capacity expansion through 2030, while CBRE’s North America report shows tight primary-market vacancy. Both signals can be true because a market can have future buildout while still lacking the right low-latency or power-ready inventory today.
For AI teams, this changes the capacity plan. Model training capacity, batch inference capacity, real-time inference capacity, and enterprise regional capacity should be planned separately. A large future campus does not automatically solve low-latency inference in a constrained metro. A cloud provider’s total AI capex does not guarantee the exact GPU class, memory configuration, region, and availability window a product team needs.
Cloud, Neocloud, And Colocation Capacity
Cloud buyers experience AI infrastructure constraints through availability, price, latency, and reserved capacity. The physical market underneath that experience is tight. CBRE’s H2 2025 report says North America primary-market supply reached 9,432 MW, vacancy dropped to 1.4%, net absorption reached 2,497.6 MW, and 5,994.4 MW was under construction, according to CBRE. Low vacancy and a large construction pipeline can coexist because capacity under construction may already be committed before delivery.
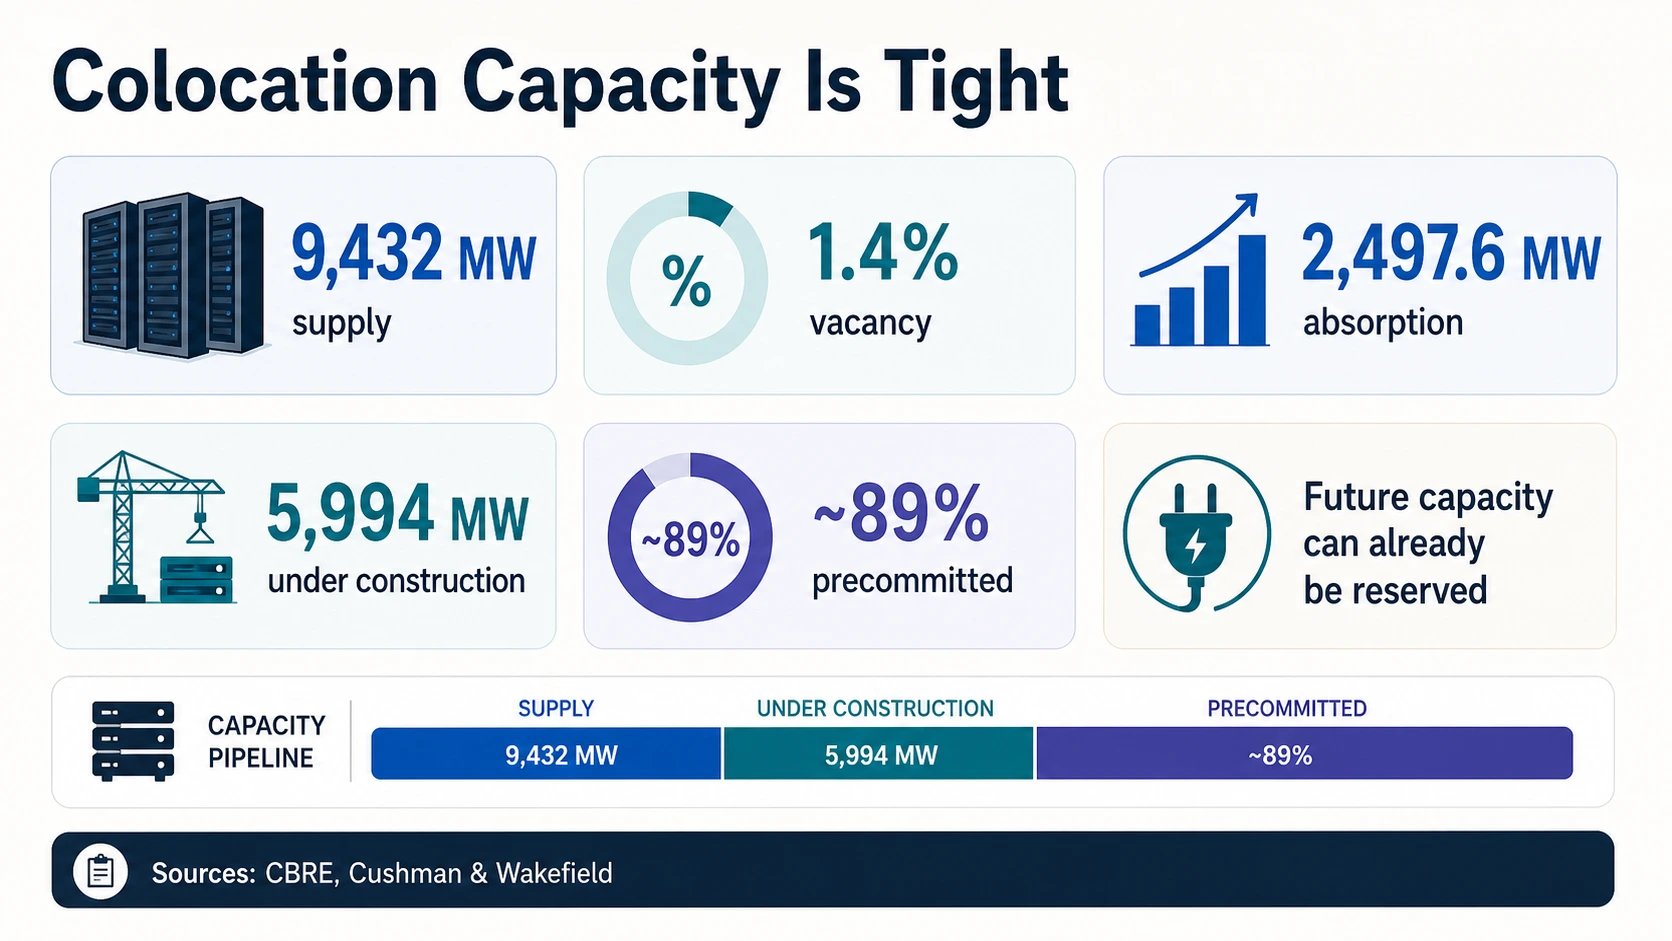
JLL and Cushman show the global and Americas buildout. JLL projects global data center capacity could reach 200 GW by 2030, with 97 GW added from 2025 to 2030. Cushman & Wakefield estimates the Americas had 43.4 GW of operational capacity in H2 2025 and 25.3 GW under construction, with nearly 89% precommitted. Those figures support the same directional conclusion: supply is expanding quickly, yet available capacity can remain scarce.
Neoclouds make the capacity stack more visible because some public providers disclose power and backlog. CoreWeave’s 2025 filing reported 43 data centers, 850+ MW active power, and 3.1 GW contracted power. CoreWeave’s Q1 2026 release said active power surpassed 1 GW, revenue backlog reached $99.4 billion, and 2026 revenue guidance was $11.2 billion–$11.4 billion. That is a useful public example of the difference between live infrastructure and future commitments.
Cloud revenue growth is a demand signal, not a capacity metric. Synergy Research describes strong cloud infrastructure growth as AI drives demand, and Synergy’s neocloud coverage discusses rapid AI-driven neocloud growth. Those links help explain buyer demand, but a revenue chart cannot answer how many MW are online, how much rack capacity is free, or whether a specific region has GPUs available.
The operator lesson is to keep procurement questions concrete. Ask whether capacity is active or contracted. Ask whether the provider controls power, colo space, networking, and cooling. Ask whether the capacity is training-optimized or inference-optimized. Ask whether the workload needs a hyperscale region, a specialty AI cloud, or a colocation deployment near users.
Why Huge Construction Pipelines Still Feel Capacity-Constrained
The biggest apparent contradiction in 2026 data center statistics is that the pipeline looks enormous while buyers still encounter scarcity. CBRE reports nearly 6 GW under construction in North American primary markets at year-end 2025. Cushman & Wakefield reports 25.3 GW under construction across the Americas. JLL projects roughly 97 GW of added global capacity from 2025 to 2030. Those are large numbers, but they sit at different points in the delivery timeline.
Several forces keep market capacity tight. First, a project under construction is not available capacity. Second, a large share of future capacity can be precommitted before the building is delivered. Cushman’s nearly 89% precommitment figure from the Americas update is the clearest signal here. Third, the bottleneck may sit outside the building envelope. A data center shell can be easier to build than the power path that energizes it. Fourth, not every MW is suitable for every AI workload.
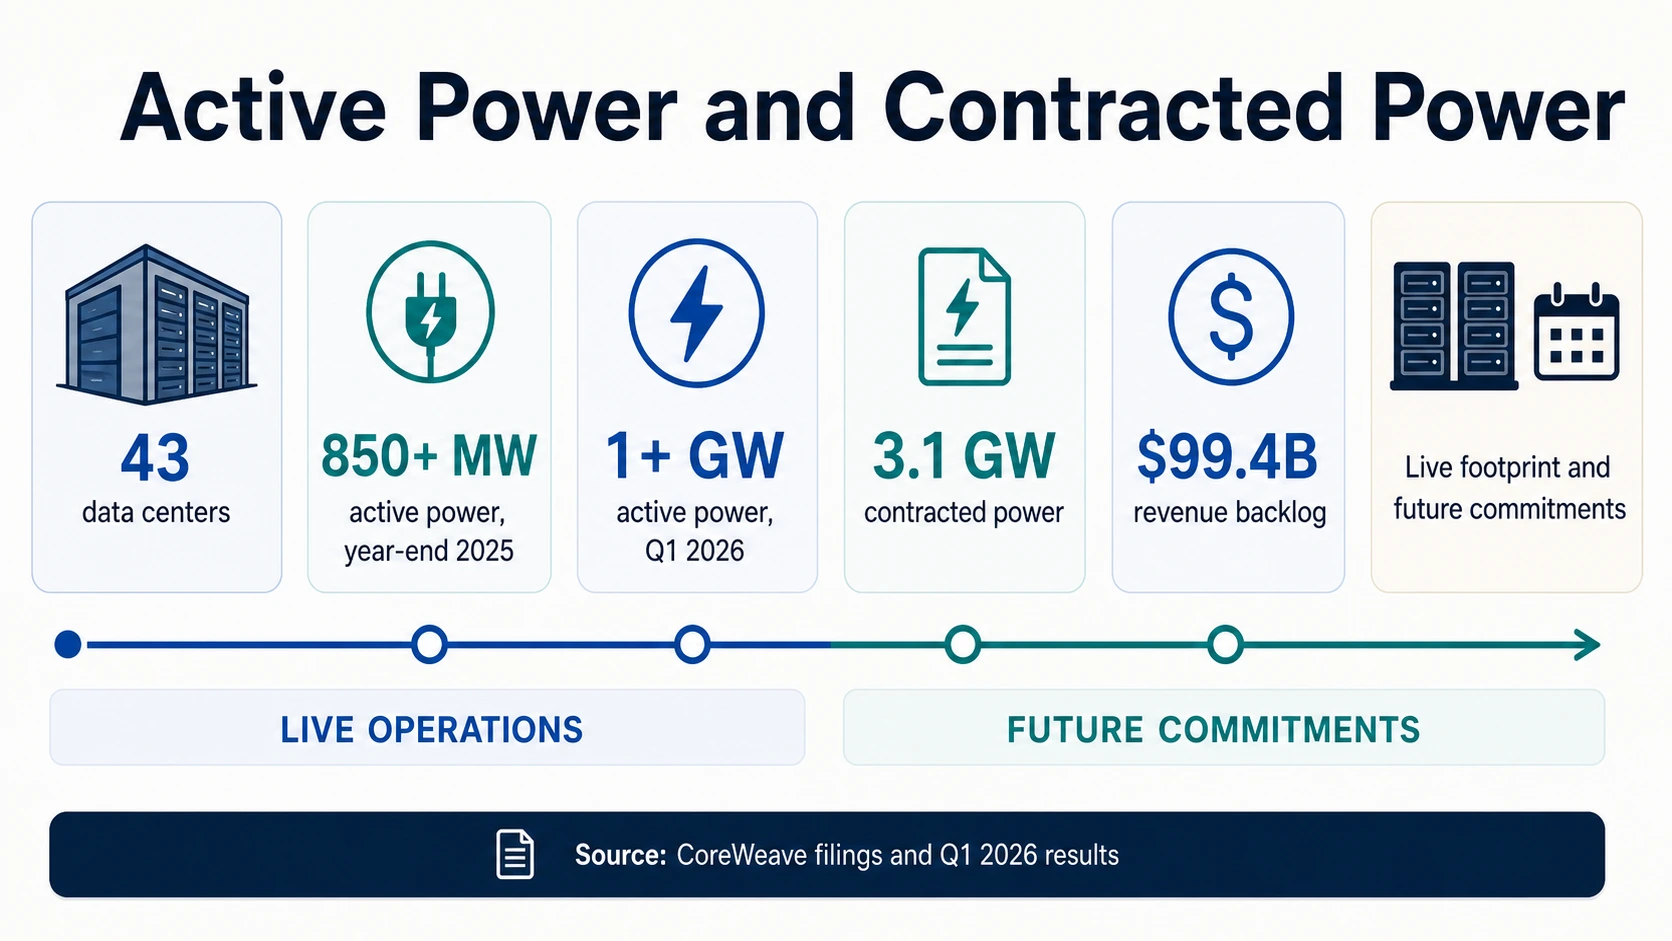
Live footprint — 1+ GW active power
CoreWeave surpassed 1 GW of active power in Q1 2026, up from 850+ MW at year-end 2025 across 43 data centers. This is power supporting current operations.
Future commitment — 3.1 GW contracted power
CoreWeave reported 3.1 GW of contracted power in its 2025 filing. Contracted power is a future supply commitment, not online capacity.
Demand backlog — $99.4B
CoreWeave reported a $99.4 billion revenue backlog in Q1 2026 with 2026 revenue guidance of $11.2B–$11.4B. Backlog is booked demand, not delivered capacity.
Announced intent — nearly 7 GW planned
OpenAI and Oracle's Stargate update described nearly 7 GW of planned capacity and more than $400 billion of investment over three years. Planned capacity is not live today.
The capacity market also has a sequencing problem. A campus can be announced, permitted, financed, leased, built, connected, commissioned, and filled with servers at different speeds. OpenAI’s Stargate plans and Amazon’s 2026 capex plans show intent and investment scale. CoreWeave’s active power shows live operating footprint. CoreWeave’s contracted power shows future commitments. The gap between those states is where buyers feel scarcity.
This is why vacancy is a particularly powerful statistic. CBRE’s 1.4% vacancy does not need to prove how many AI models are training in each facility. It proves that available primary-market data center inventory is extremely tight. When that tightness overlaps with AI-driven power density, higher capex, and longer utility timelines, the result is a market where large customers reserve capacity earlier and smaller buyers face fewer easy options.
Cooling, Water, PUE, And Sustainability Limits
AI data centers are not only power-constrained. They are cooling- and water-constrained in some locations. The most common efficiency metric is PUE, or power usage effectiveness. Google reports a trailing 12-month fleetwide PUE of 1.09, which means its facility overhead is low relative to IT power. That is impressive operational efficiency, but PUE does not mean total electricity demand is low. If IT load grows quickly, total electricity can rise even when PUE improves.
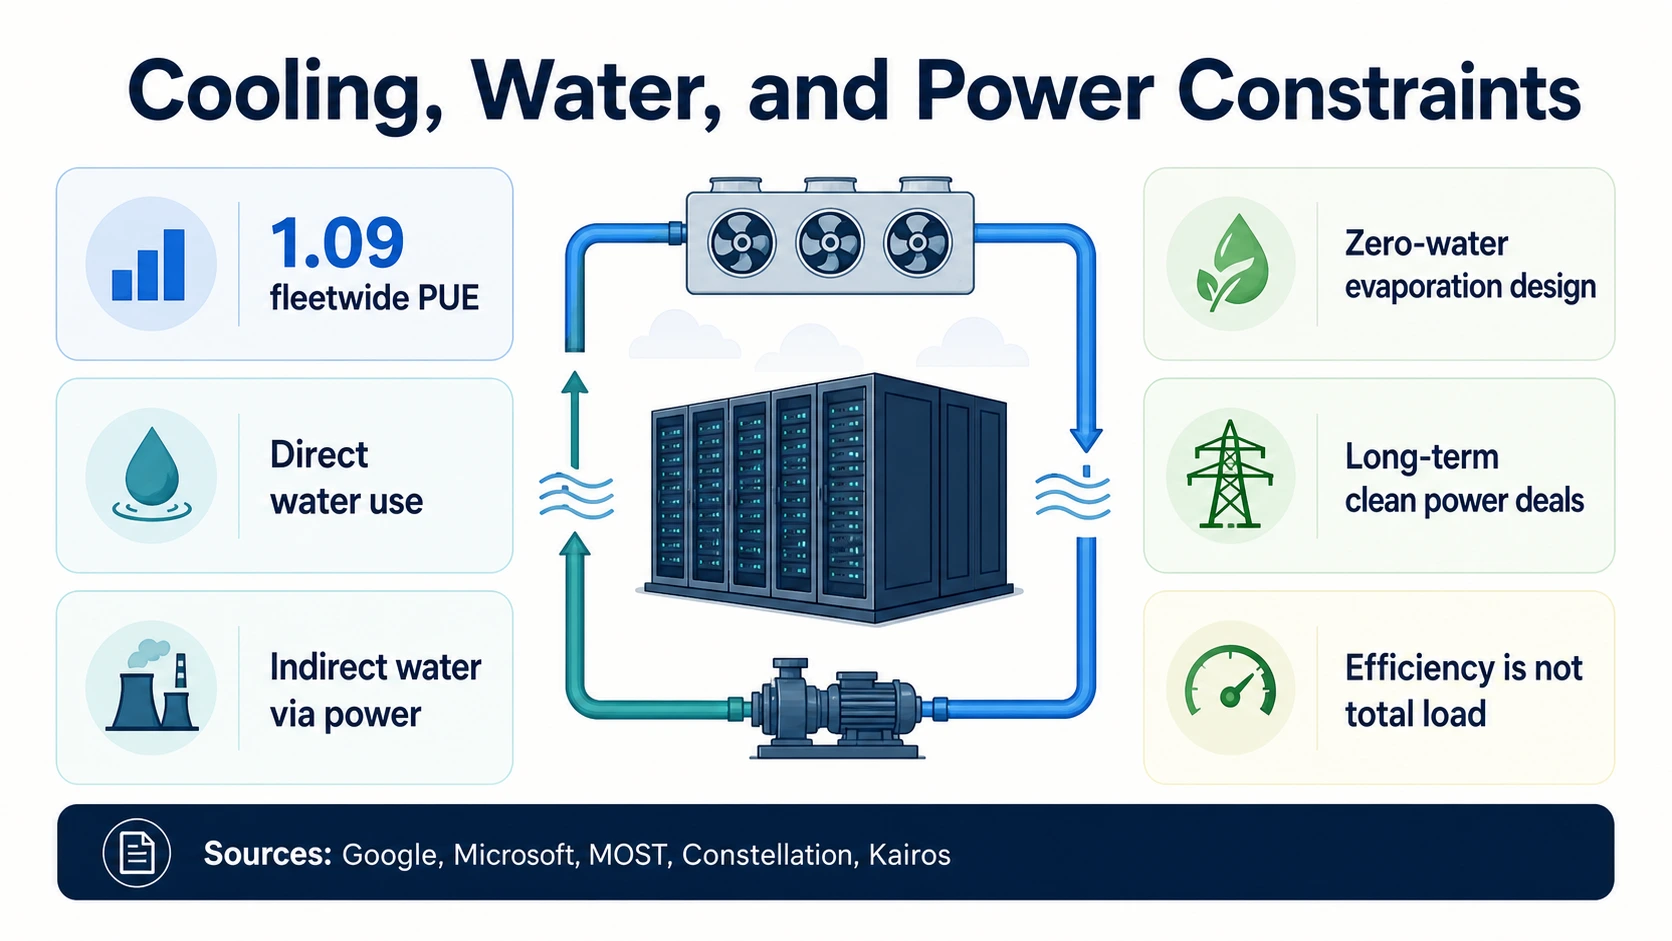
Cooling strategy is becoming a design differentiator. Microsoft has described datacenter designs that reduce or eliminate water evaporation in cooling systems, alongside broader community and water-positive commitments. These design choices matter because high-density AI racks can push facilities toward liquid cooling or hybrid cooling architectures.
Water statistics require especially careful reading. The MOST Policy Initiative note explains that data centers can consume water directly for cooling and indirectly through electricity generation. Direct facility water use, water withdrawal, water consumption, water intensity, and indirect water tied to power generation are different metrics. AI-specific water totals are often harder to verify than electricity and capacity statistics.
Power procurement is now part of the sustainability and reliability stack. Constellation’s Microsoft agreement supports restarting Three Mile Island Unit 1 as the Crane Clean Energy Center through a 20-year power purchase agreement. Google’s Kairos Power agreement covers future nuclear energy from multiple small modular reactors. These deals are significant because large AI infrastructure buyers are trying to secure firm clean energy. They should not be read as immediate data center capacity.
The environmental conclusion is nuanced. Efficiency can improve while total load rises. Low-PUE facilities can still stress local grids. Water-saving designs can reduce direct water use while power-generation water remains part of the broader footprint. Clean-energy procurement can reduce emissions exposure over time but does not remove the need for transmission, substations, and local approvals.
For local communities, the relevant numbers are often local rather than global. A worldwide 945 TWh data center forecast from the IEA matters for macro energy planning, but a community cares about a specific substation, water system, transmission corridor, tax base, noise profile, and construction schedule. The same distinction applies to water. A fleet-level PUE or water strategy from Google or Microsoft can show direction, while the project-level question remains site-specific.
The Key 2026 Constraints To Watch
The AI buildout is scaling across every layer at once, but the bottlenecks are staggered. These are the five constraints that decide whether committed investment turns into usable AI capacity.
Grid delivery
The IEA, Berkeley Lab, EIA, and DOE all point to rising data center electricity pressure. The hard question is whether regional grids can connect large loads quickly enough, not whether AI companies want more capacity.
Deliverable capacity
CBRE's 1.4% vacancy, Cushman's nearly 89% precommitment, and JLL's 97 GW projected additions show a market where future capacity is large but near-term available capacity remains tight.
Compute supply chain
NVIDIA's data center revenue and TrendForce's shipment and HBM forecasts show strong hardware demand. Yet deployment also depends on advanced packaging, HBM, networking, rack density, power gear, and data center readiness.
Timing
Amazon's, Meta's, Alphabet's, and Microsoft's 2026 capex show enormous investment. But investment can precede energization, customer availability, and revenue recognition by months or years.
Workload shape
Training clusters need large, dense, highly networked pools of accelerators. Inference needs reliable, distributed capacity close enough to users. Inference changes infrastructure planning rather than merely adding more training capacity.
What This Means If You Build, Buy, Or Operate AI Infrastructure
The practical lesson is not simply that AI infrastructure is big. It is that different numbers answer different operating questions.
AI founders
Procurement realism
A GPU access claim is only one part of the buying decision. Ask about region, availability window, reserved capacity, networking, storage, power redundancy, cooling, and whether the capacity is active or future-contracted.
CoreWeaveCloud buyers
Capex is encouraging, not sufficient
Microsoft, Alphabet, Meta, and Amazon are spending at extraordinary scale, but that does not guarantee immediate capacity in every region, GPU class, or service tier. Expect capacity planning and reserved commitments to matter more.
AmazonInfrastructure operators
The power stack is strategic
Berkeley Lab's demand forecast, EIA's regional load warning, and LBNL queue data all point to the same reality: land and capital are not enough if substations, transmission, generation, and utility approvals lag.
Berkeley LabFinance & policy readers
Separate spend from capacity
Planned capex, signed leases, contracted power, PPAs, construction pipelines, and active power each sit at a different point in the lifecycle. And Google's PUE, Microsoft's cooling work, and MOST's water note show direct and indirect water must stay separate.
MOST Policy InitiativeReading Capacity Numbers Without Getting Fooled
Use global electricity demand for macro energy pressure. Use U.S. electricity forecasts for domestic grid planning. Use server electricity when the source is explicitly server-only. Use MW and GW supply for facility capacity. Use vacancy, absorption, and precommitment for market scarcity. Use capex for investment scale. Use active power for live provider footprint. Use contracted power and planned GW for future capacity. Use GPU revenue and AI server shipments for compute-supply momentum.
Do not use those numbers as substitutes for each other. The IEA’s 945 TWh 2030 base-case projection is not the same as JLL’s possible 200 GW global capacity by 2030. CBRE’s 1.4% North America vacancy is not the same as CoreWeave’s 1+ GW active power. NVIDIA’s $75.2 billion data center revenue is not the same as deployed GPU capacity.
Frequently Asked Questions
How much electricity do data centers use?
The IEA estimates global data centers consumed about 415 TWh of electricity in 2024 and projects about 945 TWh by 2030 in its base case. In the United States, Berkeley Lab estimates data centers used 176 TWh in 2023, about 4.4% of U.S. electricity, and could reach 325 to 580 TWh by 2028.
How much are hyperscalers spending on AI data centers in 2026?
Amazon said it expects about $200 billion of capital expenditures in 2026, predominantly for AWS. Meta guided 2026 capex to $125 billion to $145 billion, Alphabet reported $35.7 billion in Q1 2026, and Microsoft reported $31.9 billion in Q3 FY2026 including finance leases. These are investment figures, not measures of online AI capacity.
What is the data center vacancy rate?
CBRE reports that North American primary-market data center vacancy fell to 1.4% at year-end 2025, with 9,432 MW of supply, 2,497.6 MW of net absorption, and 5,994.4 MW under construction. A 1.4% vacancy rate means available primary-market inventory is extremely tight.
How much data center capacity is being built?
JLL projects global data center capacity could reach 200 GW by 2030, with roughly 97 GW added from 2025 to 2030. Cushman & Wakefield estimates the Americas had 43.4 GW operational in H2 2025 and 25.3 GW under construction, with nearly 89% already precommitted before delivery.
How much is NVIDIA making from data centers?
NVIDIA reported $115.2 billion of data center revenue in FY2026, up 142% year over year, and $75.2 billion in Q1 FY2027, up 92% year over year. That revenue signals extraordinary demand for accelerators, systems, and networking, but it does not disclose how many GPUs are deployed or where.
Why does AI data center capacity feel scarce if so much is being built?
Because the numbers sit at different points in the delivery timeline. A project under construction is not available capacity, a large share of future capacity is precommitted before delivery, the power path can lag the building, and not every megawatt suits every workload. Cushman reports nearly 89% of Americas capacity under construction is already precommitted.
What is a good data center PUE?
Google reports a trailing 12-month fleetwide power usage effectiveness (PUE) of 1.09, which is strong operational efficiency. PUE measures facility overhead relative to IT power, so a low PUE does not mean total electricity use is low — total load can still rise as IT demand grows.
Is grid capacity a bottleneck for AI data centers?
Yes. Berkeley Lab reports more than 8,200 active U.S. generation projects representing 1,312 GW of generation and 749 GW of storage in interconnection queues at the end of 2025, but queued generation is not ready AI power. The DOE cites analysis that data centers could grow from about 4% of U.S. electricity in 2023 to as much as 9% by 2030.
Sources and Further Reading
Electricity demand, grid & policy
Market supply, colocation & capacity
Hyperscaler capex & planned infrastructure
Hardware, cooling, water & power procurement