AI Startup Statistics 2026
Last updated on July 15, 2026

A source-by-source read of the 2026 AI startup funding data — what each number actually measures, why the databases disagree, and what the evidence does and does not prove.
AI startup statistics are unusually hard to summarize because “AI startup” is not a standardized statistical category. Venture databases, policy organizations, surveys, and investor reports measure different things: venture capital, broader private investment, newly funded companies, enterprise software spending, unicorn formation, infrastructure capex, or AI adoption. Those are related signals — but they are not interchangeable.
The strongest evidence shows a clear pattern for this 2026 update: AI has become the dominant category in venture financing, especially in the United States, while funding concentrates in a small number of compute-heavy companies and foundation model developers. Enterprise adoption is broad, but measurable business impact and durable startup revenue remain harder to verify from public data.
This article uses public sources available as of July 2, 2026. Because 2026 is still in progress, it separates Q1 and year-to-date signals from the strongest full-year 2025 datasets — and it avoids unsupported claims such as exact global startup counts, aggregate startup revenue, or generic “AI market size” estimates without transparent methodology.
Top Statistics
Each figure below is attributed to a specific source and metric definition. Read the sections that follow for the caveats — these totals use different methodologies and should not be blended into a single number.
2026 year-to-date
2025 full-year baselines
Geography — 2025 AI VC
Generative AI
Momentum — 2024 to Q1 2025
Valuations & concentration
Enterprise demand
Definitions: What Counts as an AI Startup Statistic?
The most important caveat in AI startup statistics is definitional. A funding total, a private-investment total, an enterprise-spending estimate, and a unicorn count may all describe the AI startup ecosystem — but they measure different layers of it.
Venture capital
OECD · Preqin
VC allocated to AI firms — a VC-specific lens. Not all private capital, cloud capex, or enterprise software budgets.
OECDPrivate investment
Stanford AI Index
External funding for private AI companies raising over $1.5M — a broader base than VC alone.
Stanford HAIProprietary databases
Crunchbase · PitchBook · CB Insights
Each classifies and counts deals differently, so 2025 totals diverge by coverage and inclusion rules.
PitchBookSurvey demand
Menlo · McKinsey · PwC
Self-reported adoption, modeled spend, and budget intentions — demand signals, not audited revenue.
McKinseyOECD’s 2026 policy brief measures venture capital investments in AI firms using OECD.AI and Preqin data. It is a VC-specific view — useful for understanding how venture investors allocated capital, but it does not represent all private capital, public-company spending, cloud capex, or enterprise software budgets (OECD).
Stanford AI Index uses a broader measure of private investment based on Quid data, tracking external funding for privately held AI companies that raised more than $1.5 million (Stanford HAI). Our World in Data reproduces this series, inheriting the Stanford/Quid methodology (OWID).
Crunchbase, PitchBook, and CB Insights each maintain proprietary databases, so their figures differ by classification, coverage, and deal-inclusion rules. OECD reports $258.7 billion of global AI VC in 2025 while PitchBook reports $243.9 billion (PitchBook) — not a contradiction, a methodology difference.
Enterprise demand sources measure something different again. Menlo Ventures models enterprise GenAI spending from a survey of about 500 U.S. decision-makers (Menlo); McKinsey measures self-reported adoption across 1,993 respondents in 105 countries (McKinsey); PwC measures budget intentions — not realized spending — from 308 U.S. executives (PwC).
A good reading therefore begins with the metric definition. VC-only numbers should not be compared directly with broader private investment; survey-based numbers are not audited spending; unicorn counts depend on private valuations that can be stale, opaque, or re-priced in later rounds.
Global AI Startup Funding and Private Investment
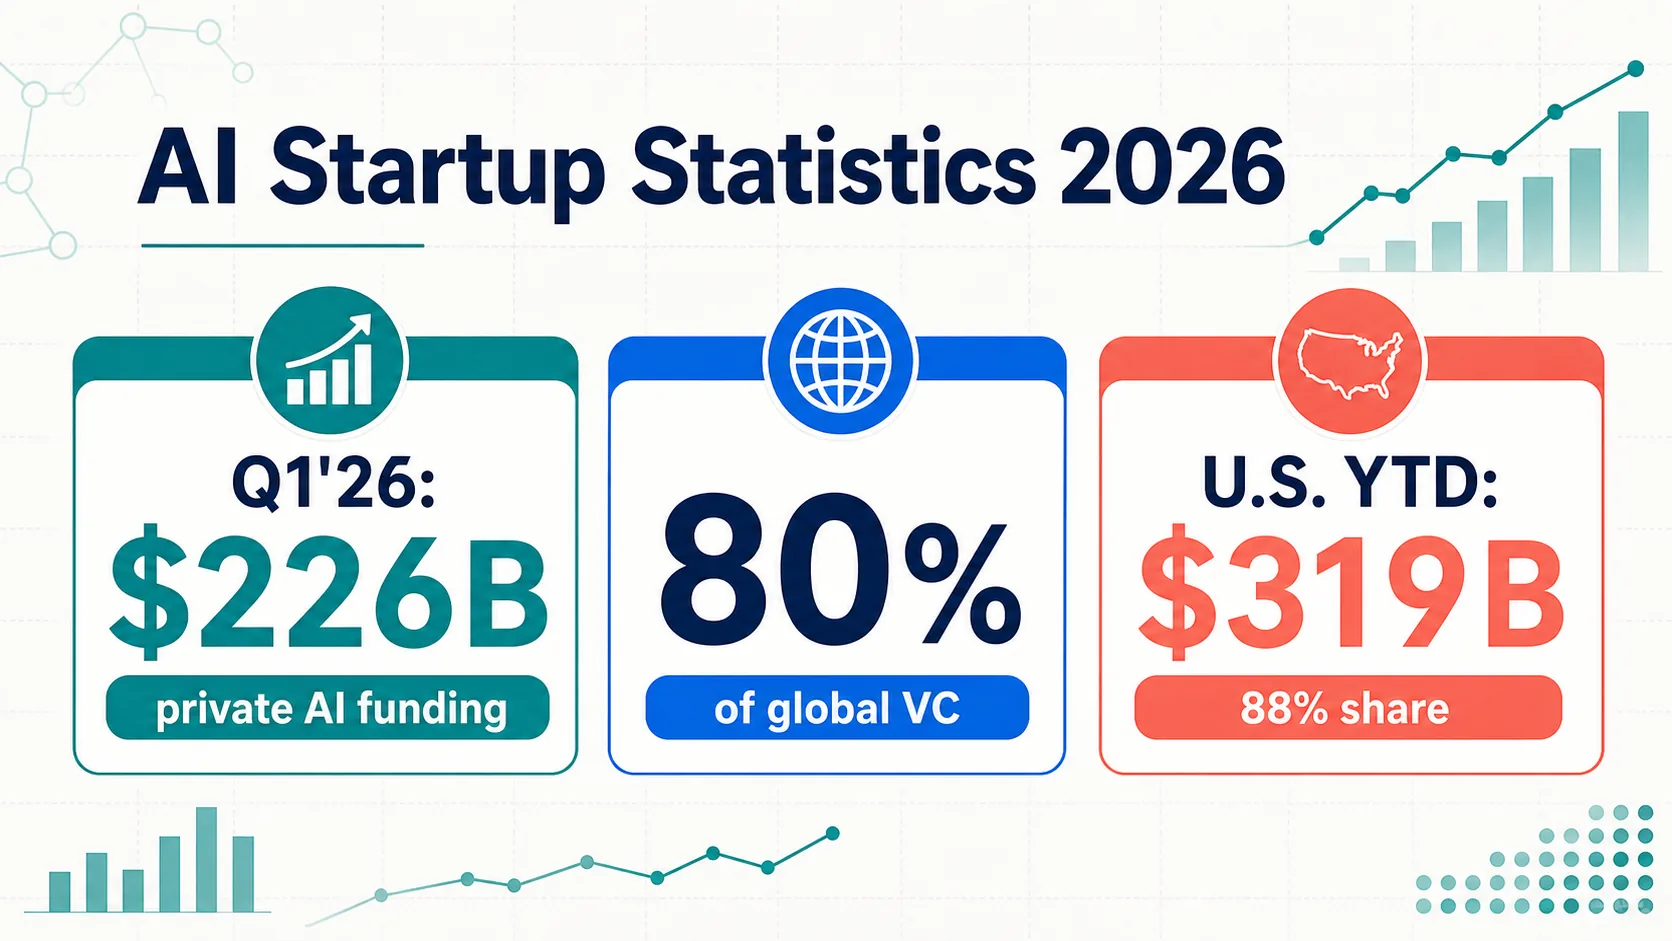
The clearest 2026 update: the AI funding boom did not stop at the 2025 year-end boundary. CB Insights reported $226 billion in Q1 2026 funding for private AI companies (CB Insights). Crunchbase’s broader picture: $300 billion in global startup investment, with AI receiving $242 billion — 80% of the total (Crunchbase). These are Q1 snapshots, not full-year totals.
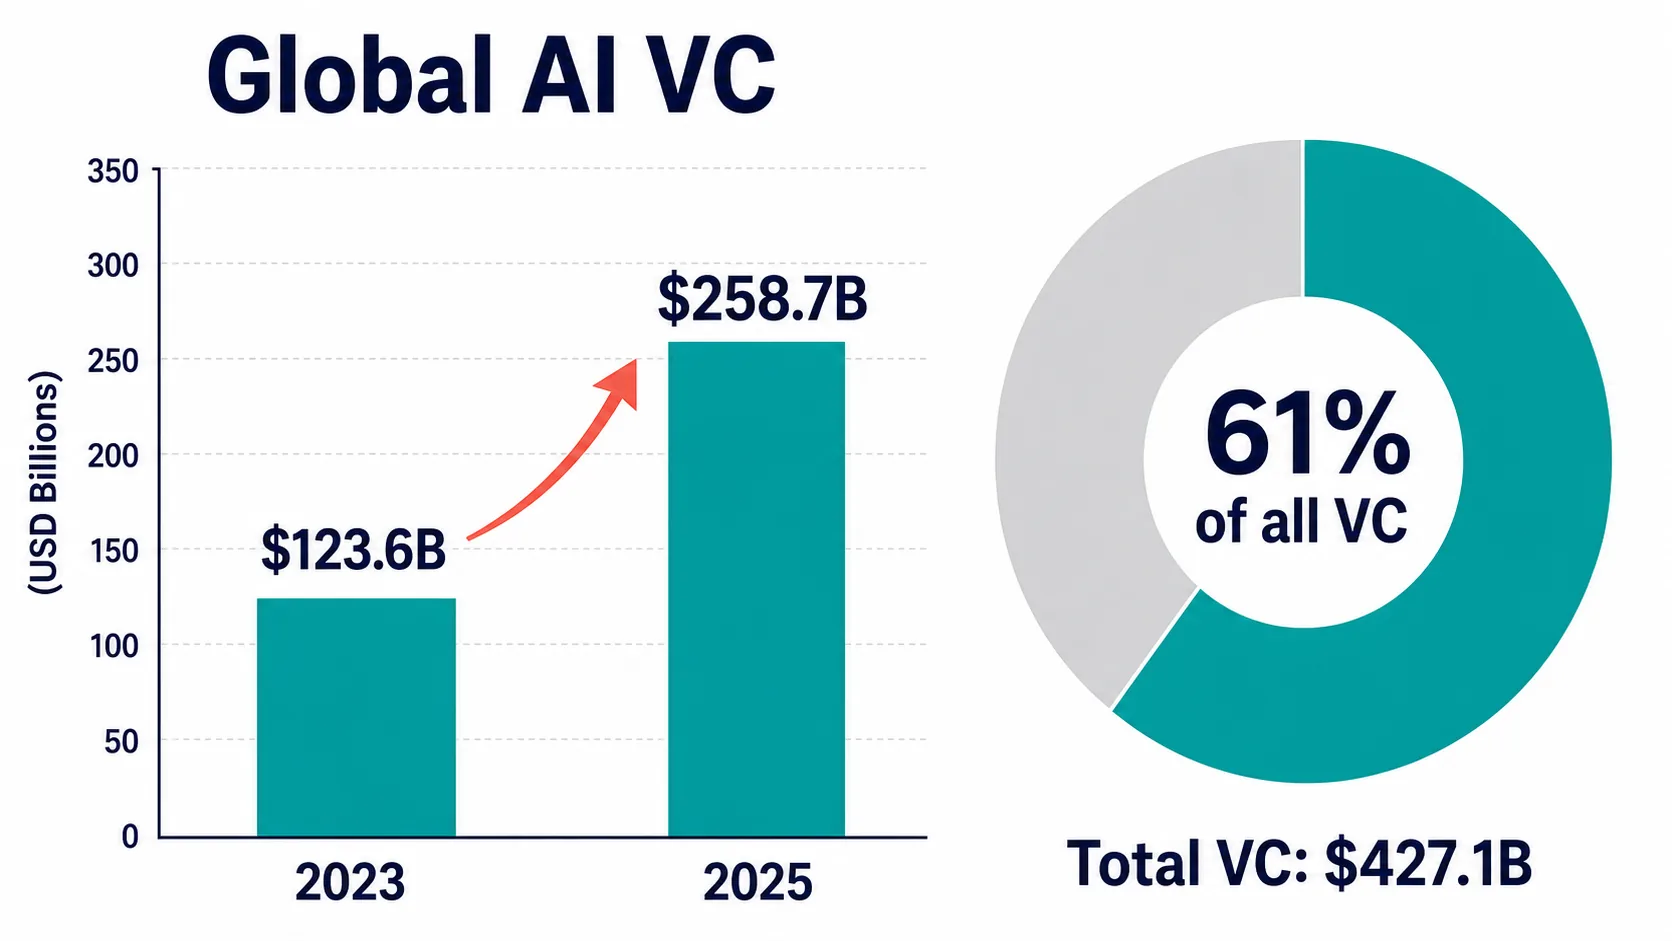
The strongest full-year finding is that AI absorbed an unusually large share of venture capital in 2025. OECD reports global AI VC of $258.7 billion — 61% of all VC in its Preqin-based dataset, up from $123.6 billion in 2023 (OECD). Under that methodology, AI became a majority share of venture capital.
PitchBook’s 2025 estimate is slightly lower but directionally similar: $243.9 billion, more than half of global venture deal value (PitchBook). The similarity supports the broad conclusion; the gap illustrates why individual database totals should not be blended into a single “true” figure.
Crunchbase reported global venture funding of about $314 billion in 2024 with AI surpassing every previous year including 2021 (Crunchbase), and nearly half of global funding in 2025. CB Insights recorded Q1 2025 AI funding of $66.6 billion — up 51% quarter over quarter, across 1,134 deals — and more than $200 billion for full-year 2025 (CB Insights).
Stanford AI Index adds a broader private-investment lens: U.S. private AI investment reached $285.9 billion in 2025 (Stanford HAI). Because it tracks external funding above $1.5 million, it should not be collapsed into the VC-only totals.
Generative AI Startup Funding
Generative AI is a major but not identical subset of AI funding. Stanford AI Index 2025 put global private investment in generative AI at $33.9 billion in 2024 — up 18.7% year over year and more than 8.5× 2022 levels (Stanford HAI).
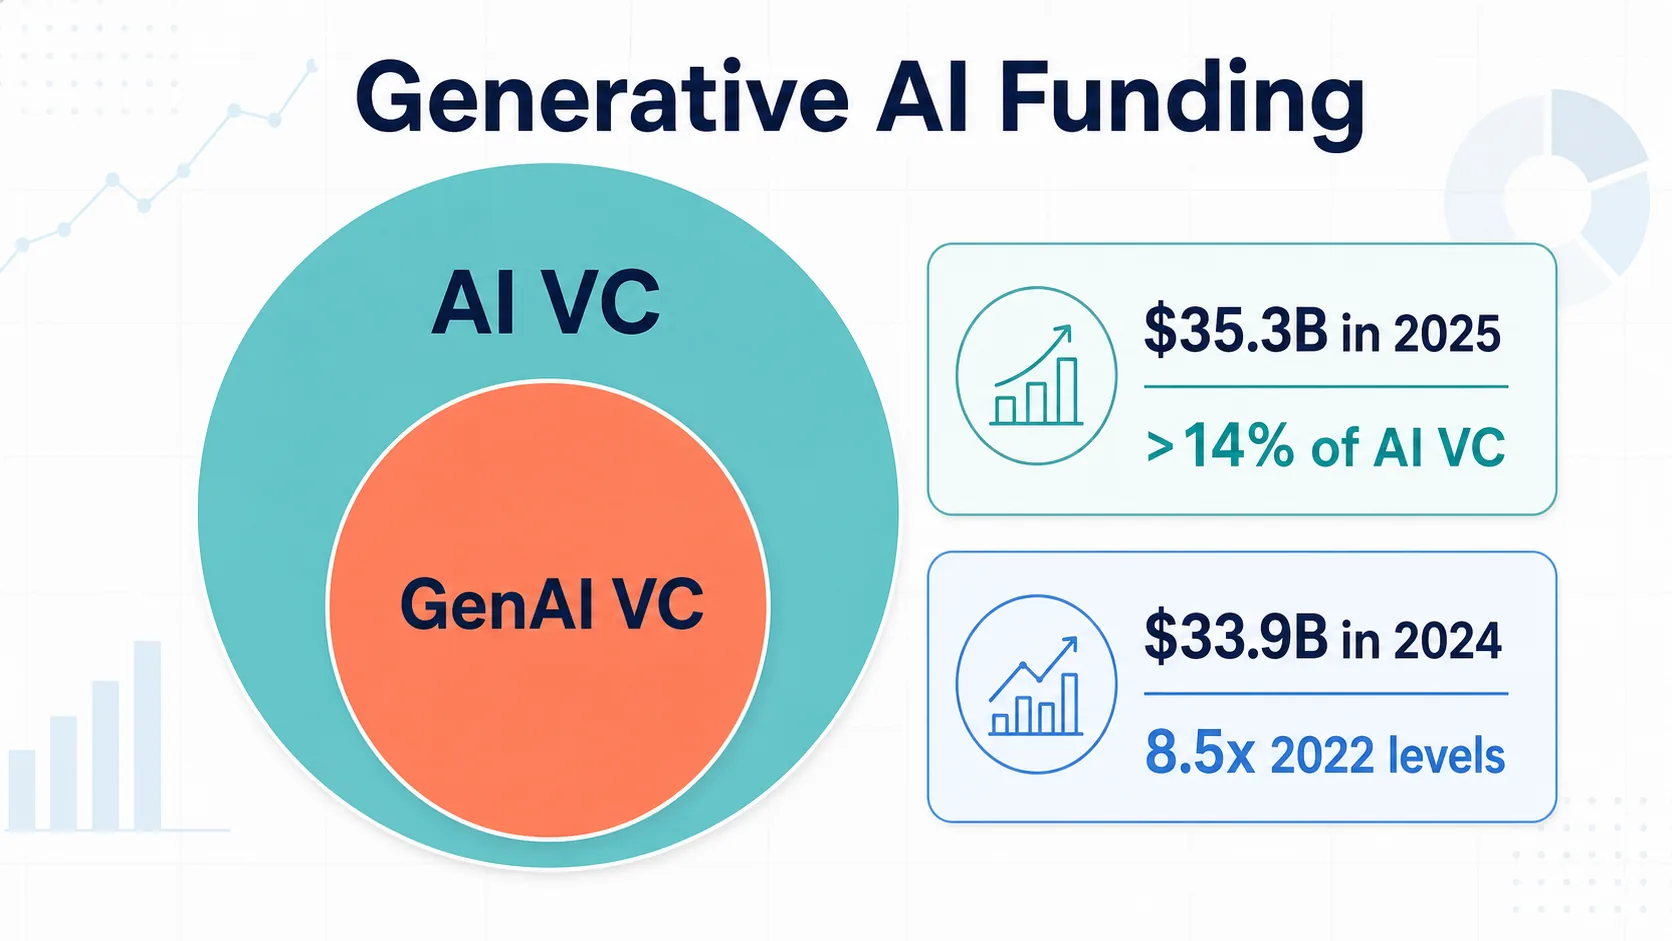
OECD reports generative AI VC of $35.3 billion in 2025, more than 14% of AI VC (OECD). The figure is lower than some market commentary because OECD measures VC specifically — not all private investment or enterprise spending.
CB Insights attributes the Q1 2025 surge partly to frontier GenAI and infrastructure, with mega-rounds from OpenAI, Anthropic, and Safe Superintelligence driving the quarter’s $66.6 billion (CB Insights).
Menlo Ventures provides the demand-side complement: enterprise GenAI spending of about $24 billion in 2025, up from ~$11.5 billion in 2024 — and in another cut, $37 billion split $19B applications / $18B infrastructure (Menlo). Enterprise spending is a demand signal, not venture funding: “generative AI funding” can mean three adjacent but different numerators.
Infrastructure, Compute, and Foundation Model Labs
The funding boom is heavily shaped by infrastructure and foundation model economics. Training and serving large models requires compute, cloud capacity, specialized chips, and technical talent — so funding totals are disproportionately affected by a handful of very large rounds.
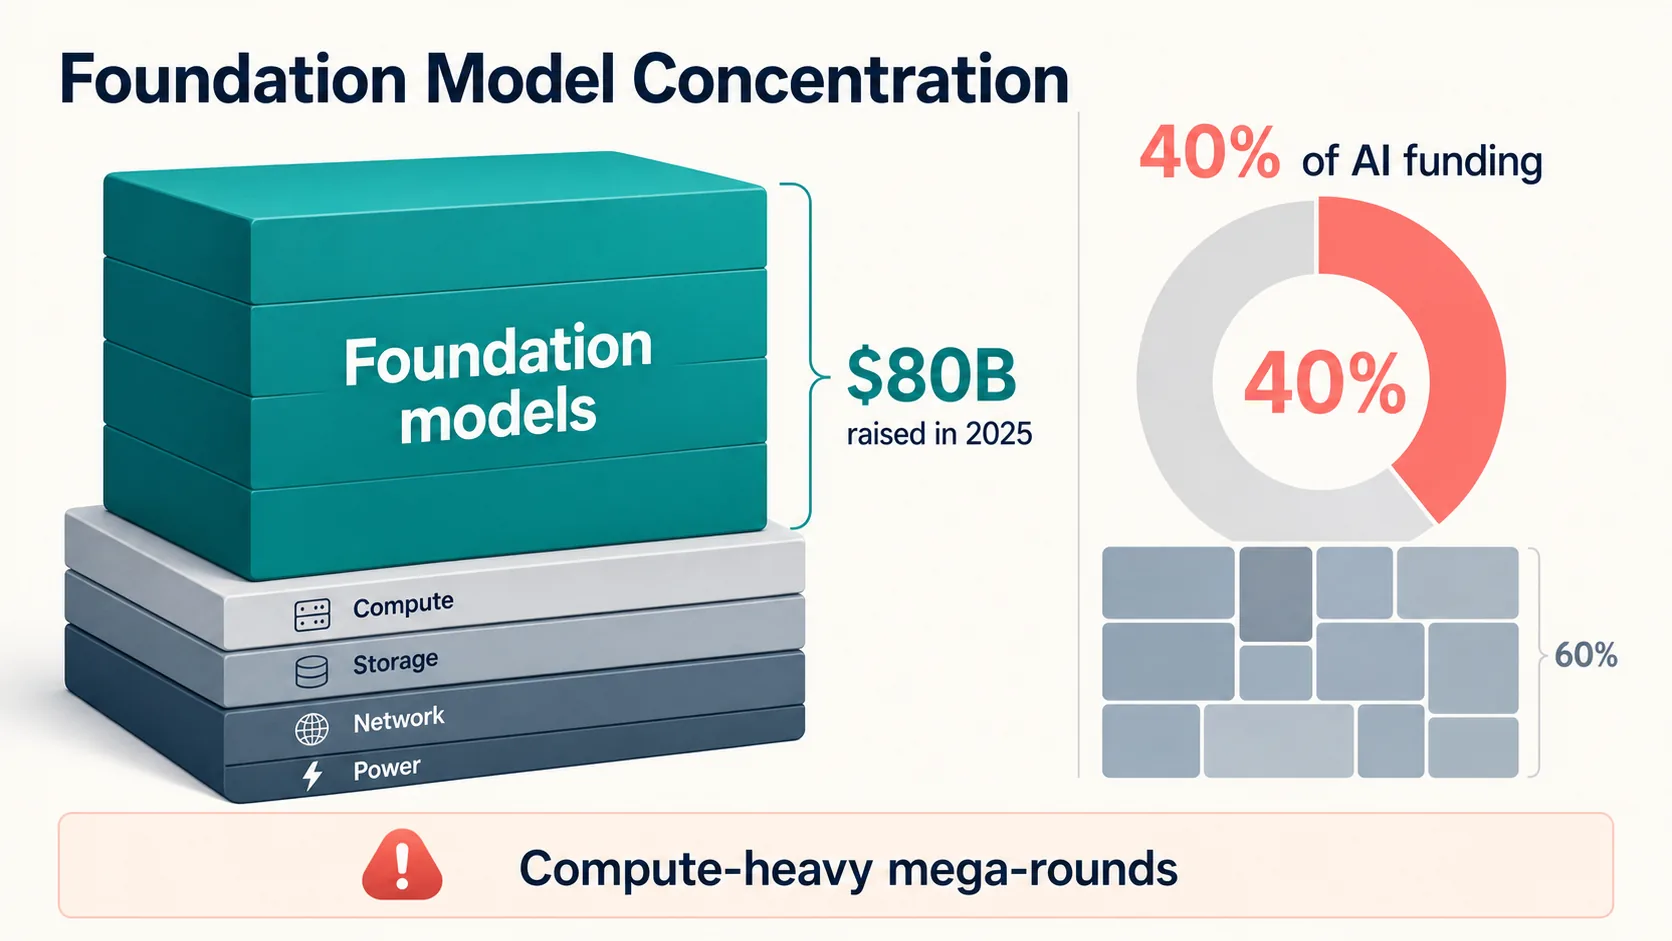
Crunchbase reported foundation model companies raised about $80 billion in 2025 — roughly 40% of global AI funding (Crunchbase). The pattern intensified in Q1 2026: OpenAI, Anthropic, xAI, and Waymo collectively raised $188 billion, about 65% of global venture investment that quarter. Early-2026 totals are both a startup-financing signal and a compute-infrastructure signal.
That is why public-company data matters even though it is not startup funding: NVIDIA’s and AMD’s SEC filings document supplier-side AI economics (NVIDIA) (AMD), while Alphabet’s investor materials and hyperscale trackers document cloud capex (TechInsights).
Stanford AI Index reports that nearly 90% of notable 2024 AI models came from industry, not academia (Stanford HAI). For startup analysis the key point: AI infrastructure is both a category and an input cost. Funding into model labs reflects the cost of compute as much as go-to-market activity — making AI venture totals less comparable to earlier software cycles.
Enterprise Demand and Spending Signals
Startup financing only matters if there is credible demand. The strongest demand-side statistics show broad adoption, rapid GenAI spending growth, and rising budget intentions — they do not prove durable revenue or positive ROI for every AI startup.
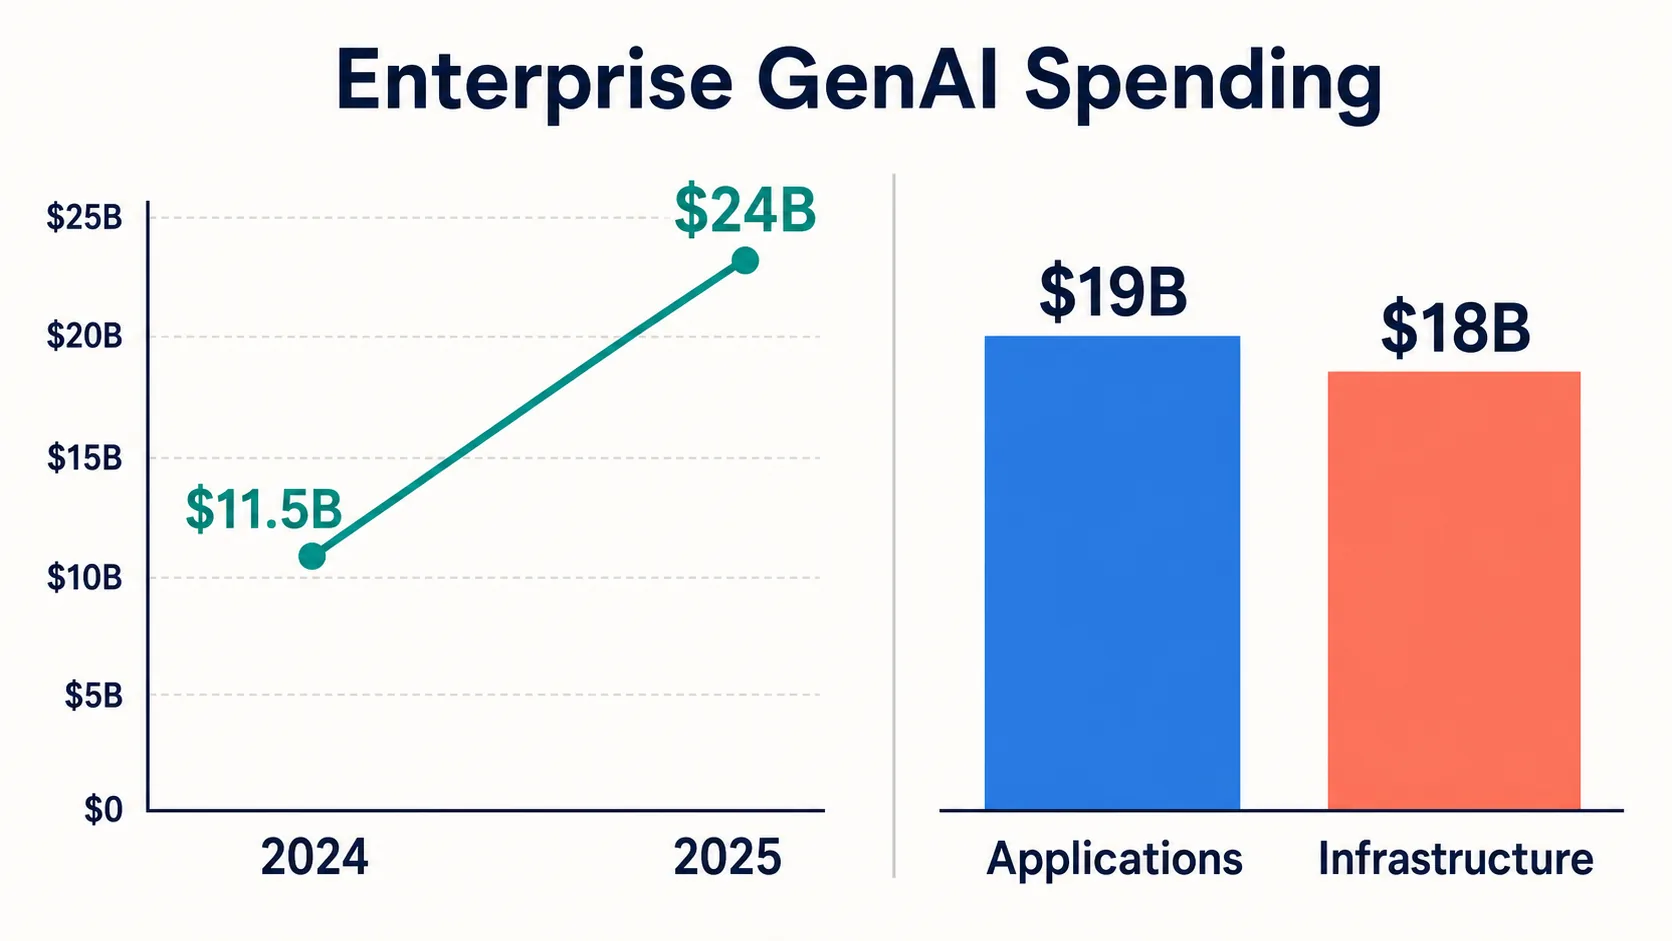
Menlo estimates enterprise GenAI spending grew from $11.5B in 2024 to **$24B in 2025**, with more than half now going to applications — where startups compete directly with incumbents. Its departmental cut: $7.3B coding and developer tools, $8.4B general-purpose copilots, $3.5B vertical AI, with healthcare leading among verticals (Menlo).
McKinsey’s 2025 State of AI survey found 88% of organizations using AI in at least one function, up from 78% — across 1,993 respondents in 105 countries (McKinsey). But only a minority report material EBIT impact: a useful caution against equating adoption with financial transformation.
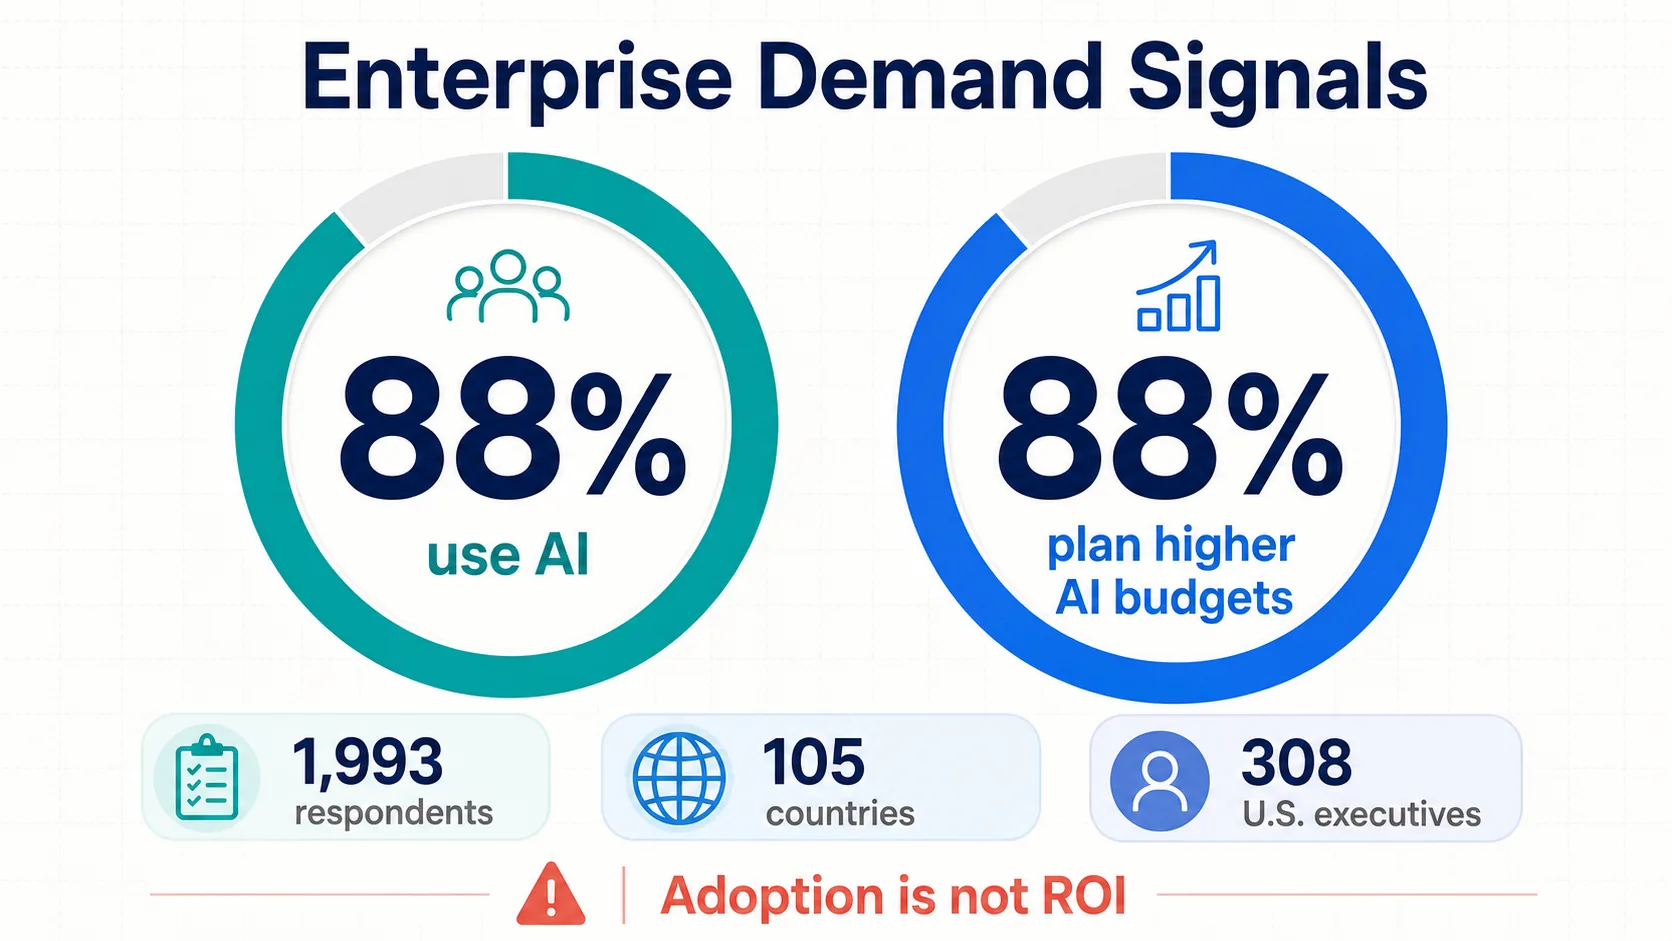
PwC found 88% of executives planning higher AI budgets over the next 12 months because of agentic AI — a survey of 308 U.S. executives measuring intentions, not realized procurement (PwC).
Microsoft’s 2025 Work Trend Index (31,000 workers, 31 countries) (Microsoft), Deloitte’s enterprise GenAI series (Deloitte), and Google’s DORA report (DORA) add workforce, governance, and developer signals. Together: demand is real and broad, but uneven in maturity, trust, and measurable financial impact.
Valuations, Stages, Unicorns, and Funding Concentration
AI startup funding is not only large; it is concentrated — in funding shares, foundation model rounds, unicorn values, and stage valuations.
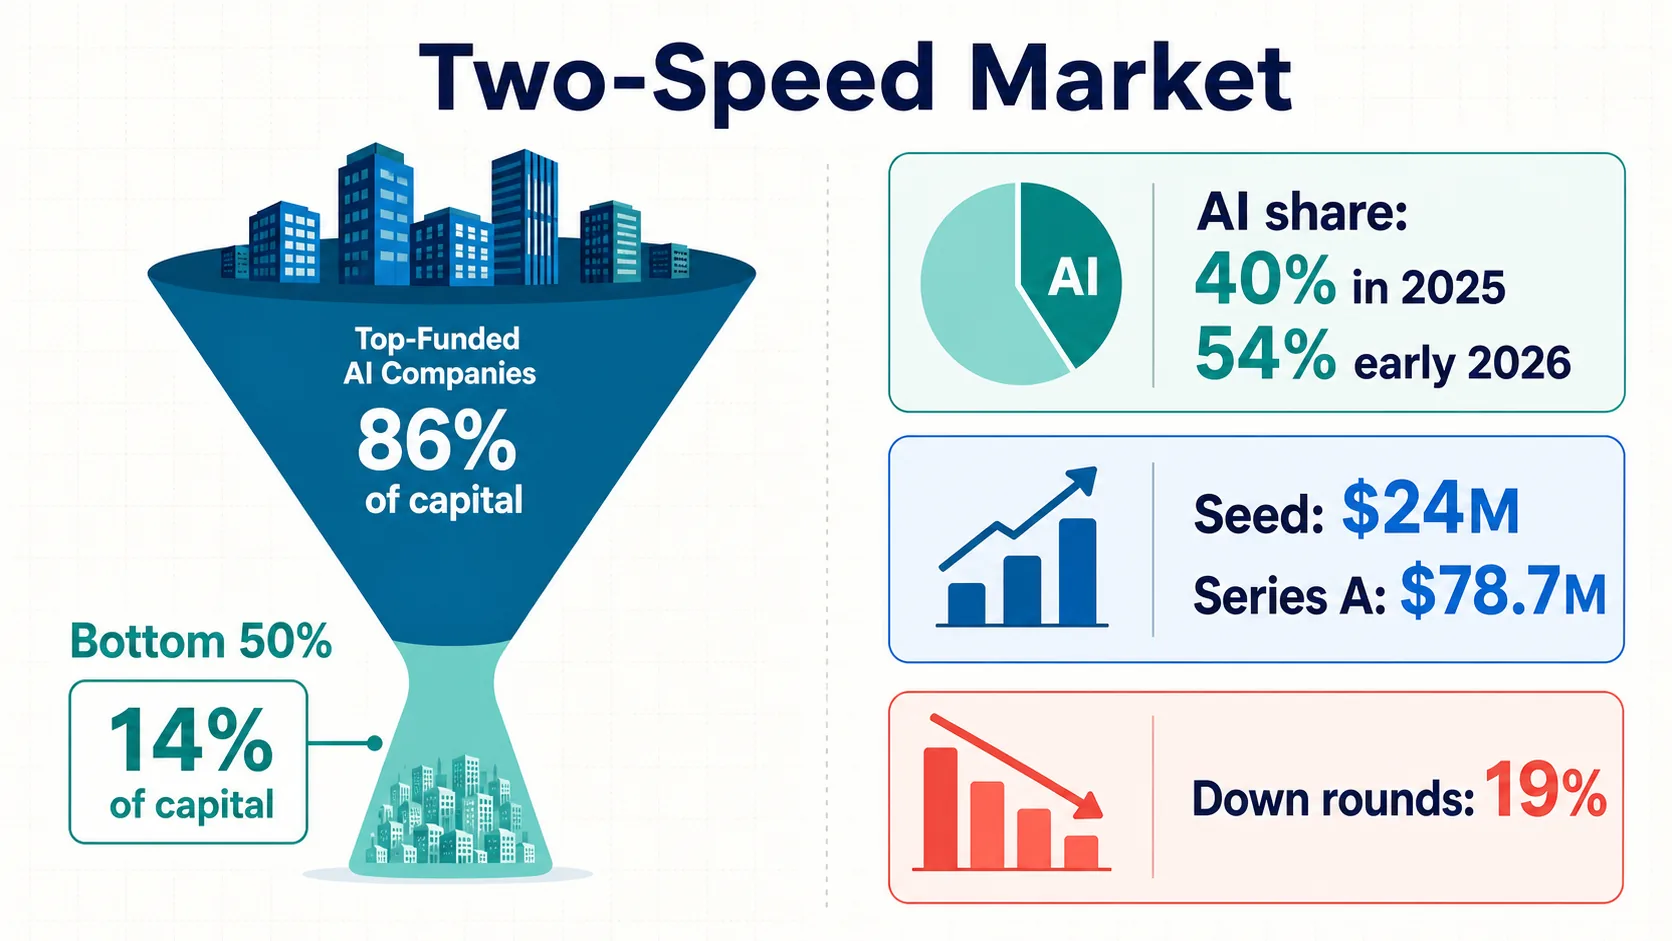
Carta reported AI companies received roughly 40% of startup investment dollars on its platform during 2025, rising to 54% in early 2026 (Carta). Not a global total — but a strong signal from a large equity-management dataset.
Carta’s Q4 2025-based analysis put the median seed post-money at $24 million and median Series A post-money at $78.7 million (Carta). Its Q1 2025 report put median seed pre-money at $16 million, with roughly $21 billion raised on Carta that quarter — and about 19% of new rounds priced down (Carta).
Concentration shows up everywhere: the bottom 50% of funded startups captured only 14% of capital raised; foundation model companies took ~40% of 2025 AI funding; and NVCA/PitchBook note that excluding the five largest exits and deals cuts Q1 2026 totals by more than 70% (NVCA).
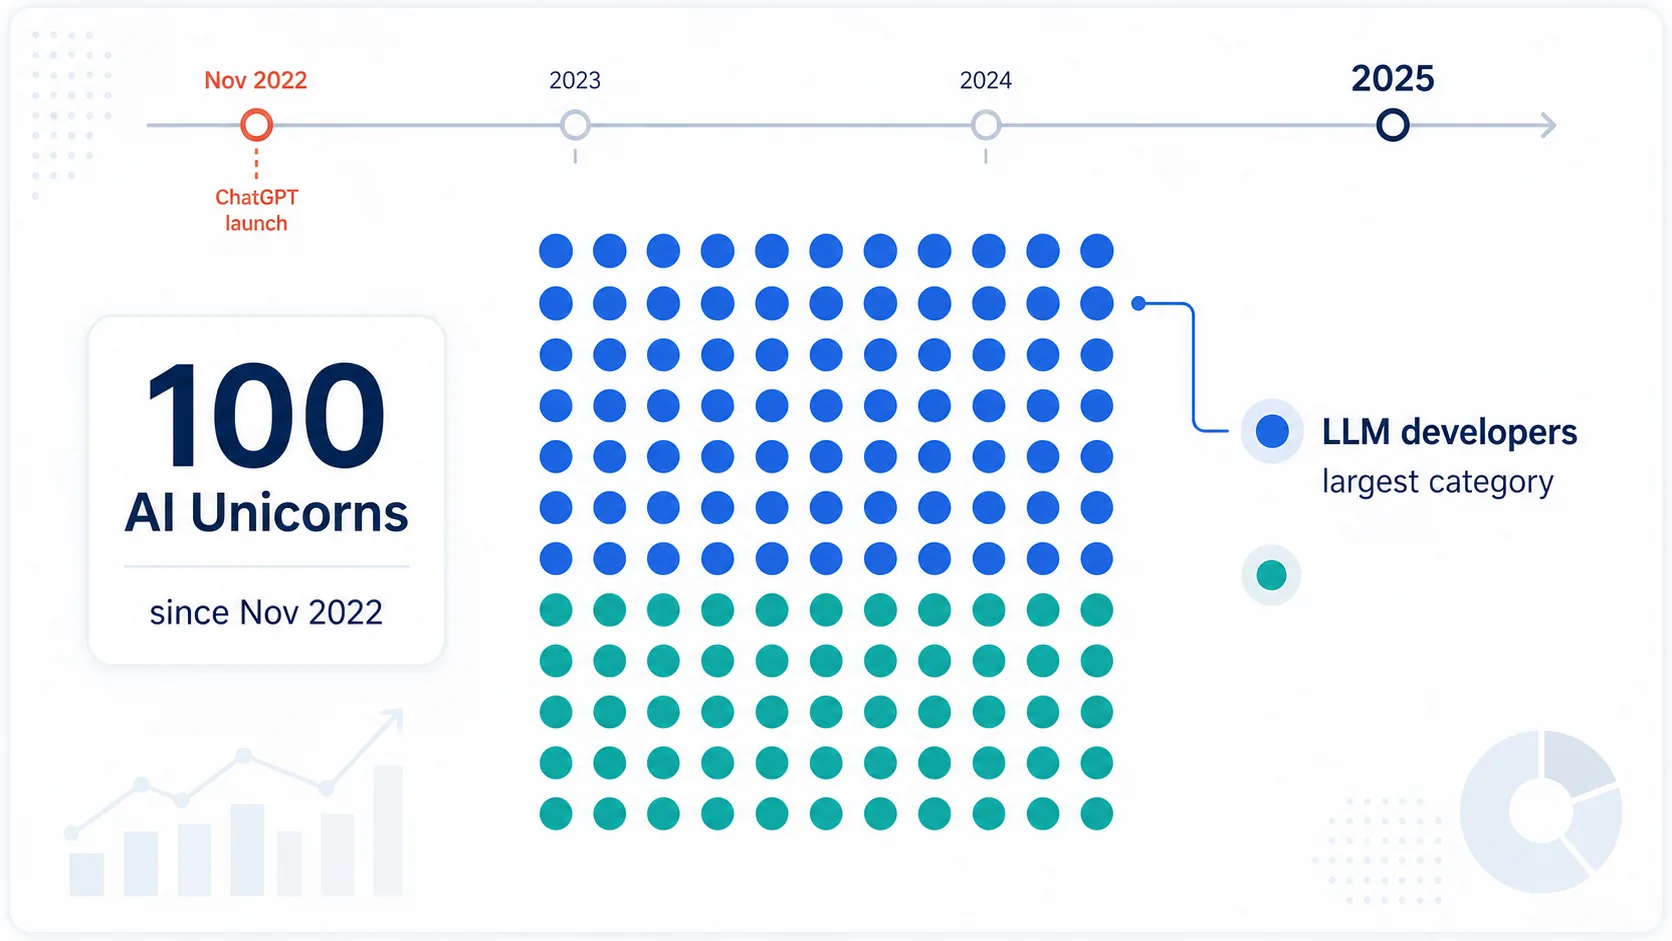
CB Insights counts 100 AI unicorns created since ChatGPT’s November 2022 launch, LLM developers the largest category (CB Insights). PitchBook says median private valuations surpassed 2021 highs across most stages in 2025, with the ten largest U.S. unicorns holding more than half of aggregate unicorn value (PitchBook). A two-speed market: enormous rounds at the top, a more selective environment — including down rounds — for everyone else.
Geography, Policy, and Talent Signals
Geographic claims are where AI startup statistics get weakest. There is no authoritative global registry of AI startups — investment geography is far more defensible than startup counts.
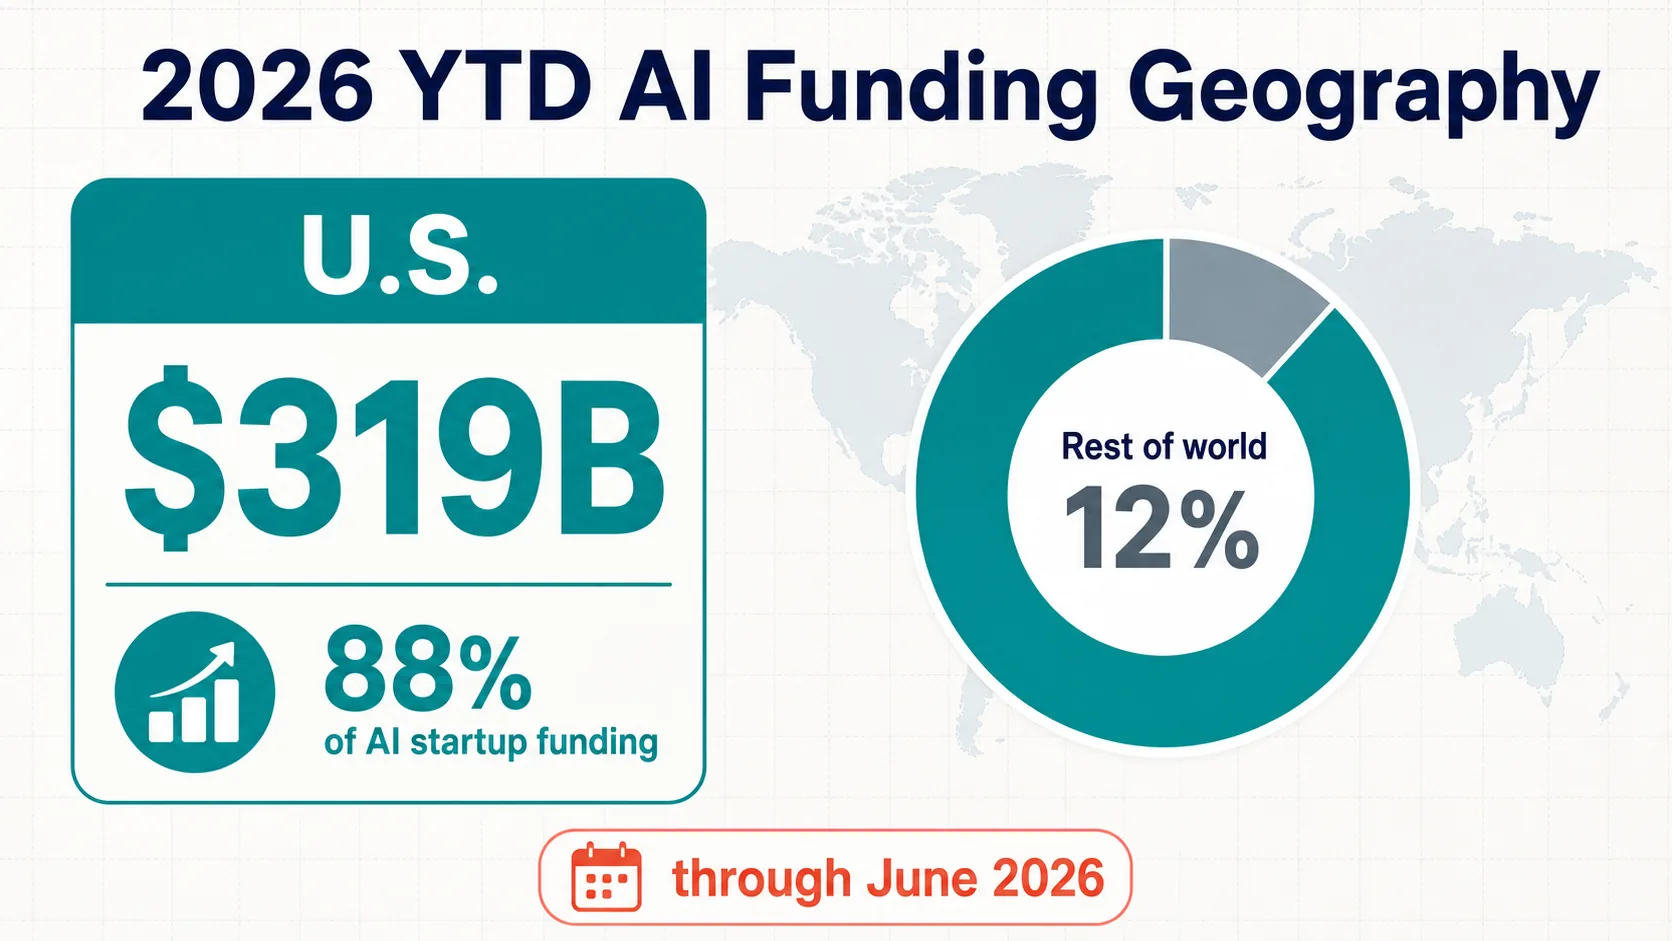
The 2026 year-to-date picture is even more U.S.-weighted than 2025: Crunchbase reports U.S.-headquartered companies received nearly 88% of AI-related startup funding so far in 2026 — $319 billion (Crunchbase). That is a funding-geography statistic, not an official count of startups.
OECD’s 2025 geography is also stark: the U.S. attracted $194 billion in AI VC (~75% of global), versus $15.8B for the EU27, $13.9B for China, and $13.8B for the UK (OECD). Stanford’s broader methodology puts U.S. private AI investment at $285.9 billion (Stanford HAI).
Ecosystems depend on more than capital. Stanford’s R&D and policy chapters (Stanford HAI), the OECD AI Observatory (OECD.AI), WIPO patent data (WIPO), and World Bank / UNDP / UN / IMF indicators support talent, policy, and per-capita comparisons. The safe conclusion is U.S. dominance in measured investment — not any exact startup count per country.
What the Data Does Not Prove
The data supports several strong statements. It does not support every popular claim about AI startups.
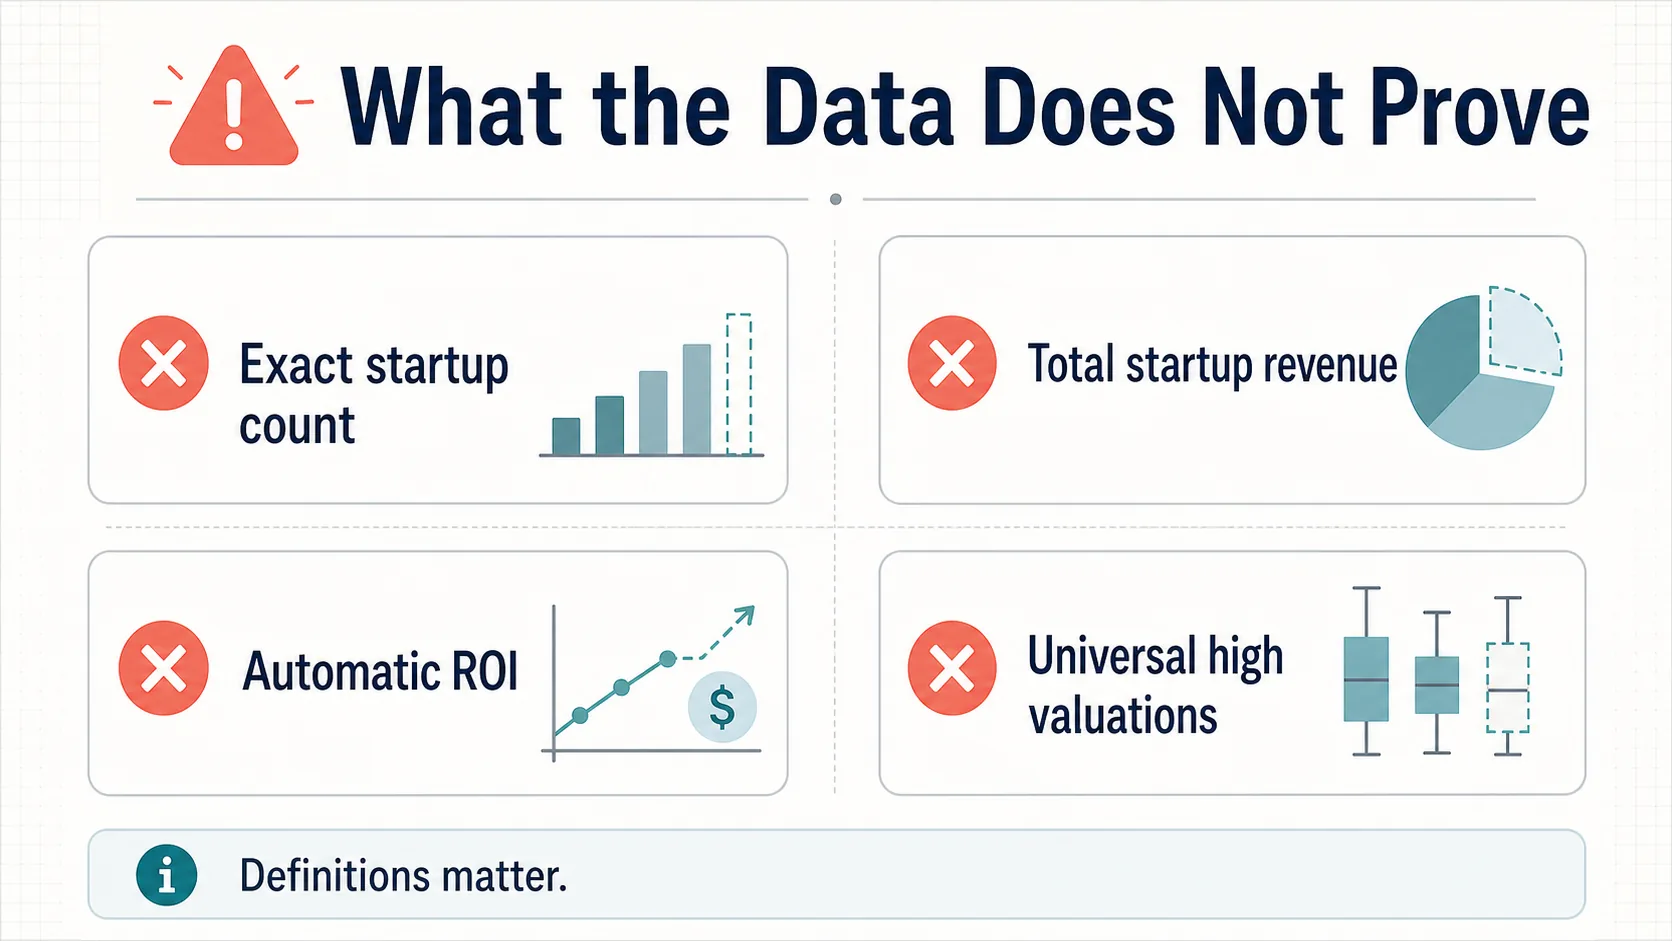
No exact global startup count.
No authoritative registry exists, and definitions vary across AI-native, AI-enabled, ML, and foundation-model companies.
No global AI startup revenue.
No public dataset captures revenue across private AI startups. Menlo's $24B / $37B figures are modeled demand estimates, not audited aggregate revenue.
Adoption ≠ financial impact.
88% of organizations use AI somewhere, but only a minority report material EBIT impact — and Deloitte tracks scaling and governance barriers rather than treating deployment as success.
High valuations are not universal.
About 19% of Q1 2025 rounds were down rounds, and the bottom 50% of funded startups captured 14% of capital. That is concentration, not a universal boom.
No defensible generic “market size”.
The strongest public indicators are funding, private investment, adoption, budget intentions, talent, policy, patents, and infrastructure signals.
How to Read AI Startup Statistics Correctly
A practical framework: keep five layers separate.
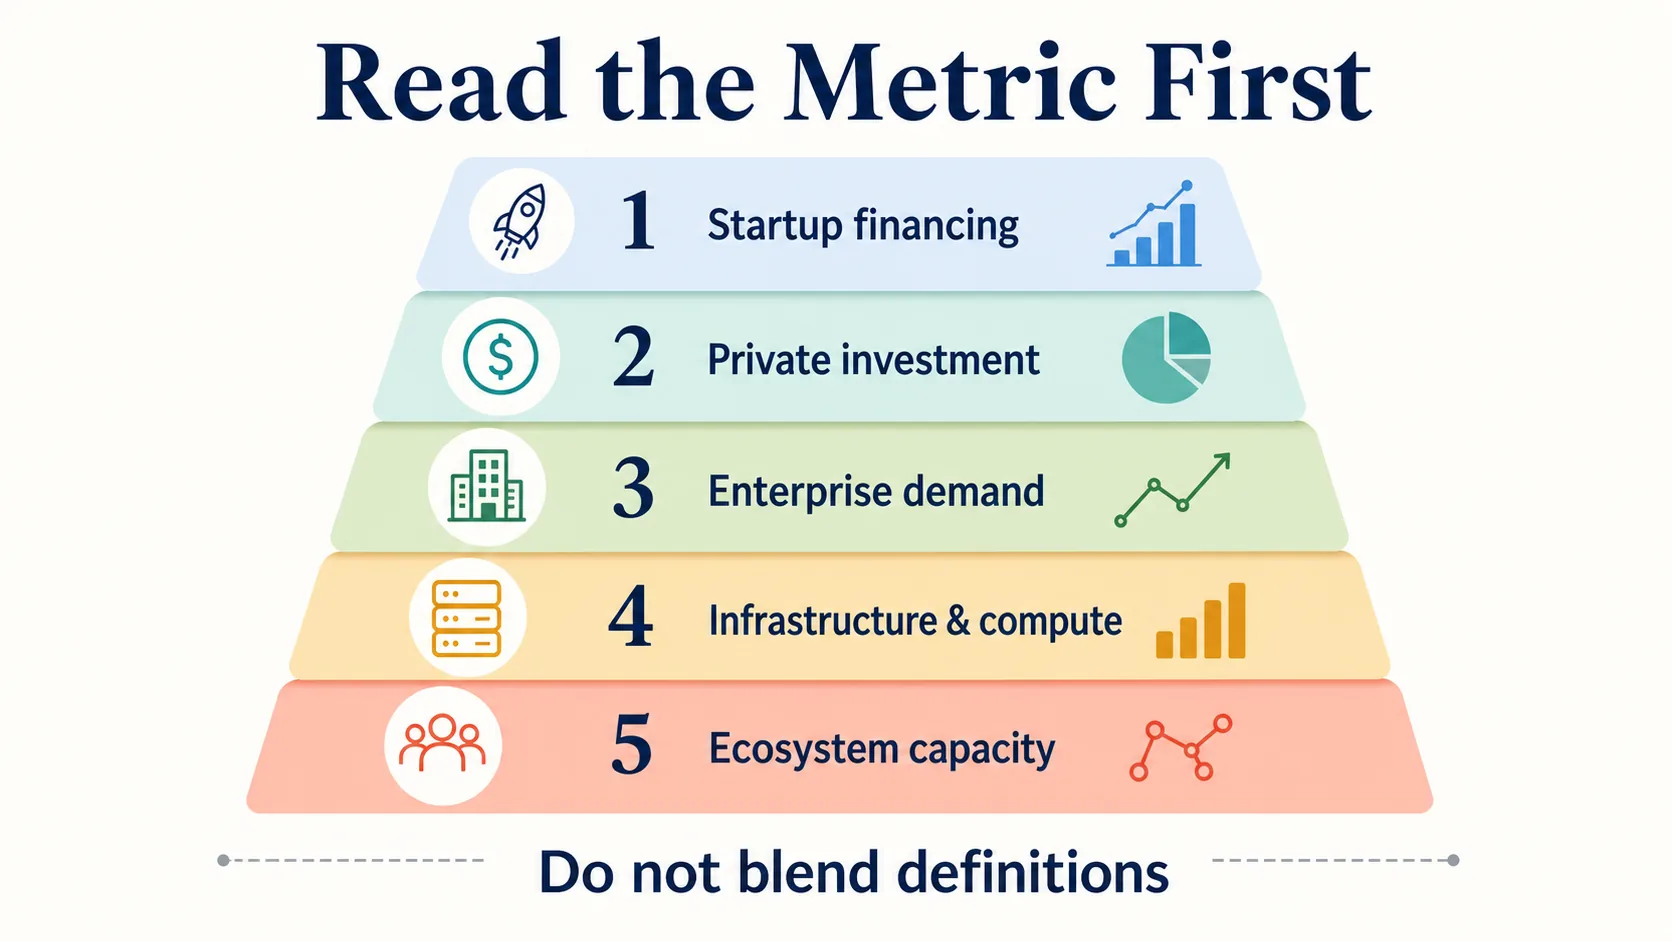
Startup financing
CB Insights' $226B (Q1 2026), Crunchbase's $242B, OECD's $258.7B (2025), PitchBook's $243.9B. Closest to capital formation — but still differs by database.
Broader private investment
Stanford's measure of external funding above $1.5M. Useful for macro comparisons; do not combine with VC-only totals.
Enterprise demand
Menlo's $11.5B → $24B spending path; McKinsey's 88% adoption; PwC's 88% budget intent. Demand signals, not funding.
Infrastructure & compute
NVIDIA, AMD, and Alphabet filings plus hyperscale trackers. Not startup funding — but it shapes startup costs and competitive dynamics.
Ecosystem capacity
AI Index chapters, OECD.AI, WIPO, World Bank, UNDP, UN, and IMF data for talent, policy, innovation, and country context.
Kept separate, the picture is clear: AI startup financing is historically large, concentrated, methodologically fragmented, and tightly linked to enterprise adoption and infrastructure constraints.
Source Quality Note
This article relies on official policy and research organizations, disclosed-methodology datasets, venture databases, primary filings, investor materials, and reputable surveys: OECD, Stanford HAI, PitchBook, CB Insights, Crunchbase, and Carta for funding; Menlo, McKinsey, PwC, Microsoft, Deloitte, and Google DORA for demand; NVIDIA, AMD, and Alphabet primary materials for infrastructure.
It intentionally avoids weak market-size pages, unsupported startup counts, and aggregator claims without transparent methodology — and it does not treat proprietary-database counts as official census data.
Frequently Asked Questions
How much did AI startups raise in 2025?
Estimates vary by methodology. OECD puts global AI venture capital at $258.7 billion (61% of all VC); PitchBook at $243.9 billion; CB Insights at more than $200 billion. Stanford’s broader private-investment measure puts U.S. AI investment alone at $285.9 billion. These are different metrics and should not be added together.
What share of venture capital went to AI?
In full-year 2025, AI was about 61% of global venture capital by OECD’s count and roughly half by Crunchbase’s. The concentration intensified in early 2026: Crunchbase reports AI companies took $242 billion — 80% of all global venture funding — in Q1 2026 alone.
Why do AI funding numbers differ so much between sources?
Because “AI startup” is not a standardized statistical category. Crunchbase, PitchBook, CB Insights, OECD and Stanford each use different definitions, coverage and deal-inclusion rules — venture capital, broader private investment, or newly funded companies. Close-but-different totals are a methodology difference, not a contradiction, and should not be blended into one number.
Which country leads AI startup funding?
The United States, by a wide margin. OECD attributes about $194 billion of 2025 AI VC (~75% of the global total) to the U.S., versus $15.8B for the EU27, $13.9B for China and $13.8B for the UK. In 2026 year-to-date, Crunchbase puts the U.S. share near 88%. This is a funding-geography measure, not a count of startups.
How many AI unicorns are there?
CB Insights counts 100 AI unicorns created since ChatGPT launched in November 2022, with large language model developers the single largest category.
Is enterprise AI adoption translating into revenue?
Adoption is broad but not proof of financial impact. McKinsey finds 88% of organizations use AI in at least one function, yet only a minority report material EBIT impact. Enterprise generative-AI spending reached roughly $24 billion in 2025 (Menlo Ventures) — but that is a demand signal, not audited startup revenue.
What is the difference between AI venture capital and private AI investment?
AI venture capital (OECD, PitchBook, CB Insights) counts venture rounds into AI companies. “Private investment” (Stanford AI Index) is broader — all external funding above $1.5 million for private AI companies. The private-investment figure is larger and should not be compared directly with VC-only totals.
Sources and Further Reading
Global AI funding & private investment
Generative AI & enterprise spending
Valuations, concentration & unicorns
Infrastructure, compute & foundation models
Enterprise adoption & demand